. 2016 Dec;5(12):692-700.
doi: 10.1002/psp4.12152.

Mechanism-Based Modeling of Gastric Emptying Rate and Gallbladder Emptying in Response to Caloric Intake

Affiliations

Mechanism-Based Modeling of Gastric Emptying Rate and Gallbladder Emptying in Response to Caloric Intake

B Guiastrennec et al. CPT Pharmacometrics Syst Pharmacol. 2016 Dec.

Abstract

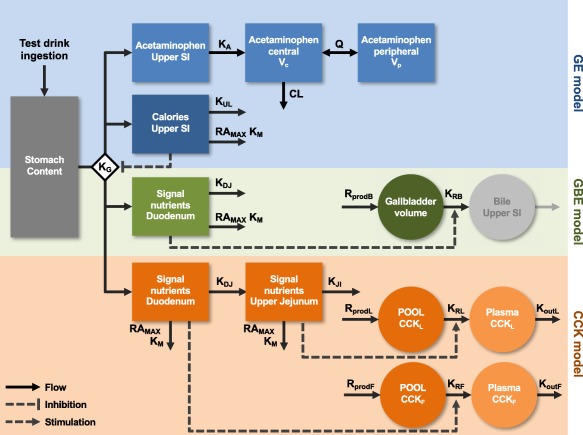
Bile acids released postprandially modify the rate and extent of absorption of lipophilic compounds. The present study aimed to predict gastric emptying (GE) rate and gallbladder emptying (GBE) patterns in response to caloric intake. A mechanism-based model for GE, cholecystokinin plasma concentrations, and GBE was developed on data from 33 patients with type 2 diabetes and 33 matched nondiabetic individuals who were administered various test drinks. A feedback action of the caloric content entering the proximal small intestine was identified for the rate of GE. The cholecystokinin concentrations were not predictive of GBE, and an alternative model linking the nutrients amount in the upper intestine to GBE was preferred. Relative to fats, the potency on GBE was 68% for proteins and 2.3% for carbohydrates. The model predictions were robust across a broad range of nutritional content and may potentially be used to predict postprandial changes in drug absorption.


Figures

Figure 1
Figure 1
Schematic representation of the selected gastric emptying (GE, blue), cholecystokinin (CCK, orange), and gallbladder emptying (GB, green) models structure. The test drink was administered to the stomach (dark gray). The GE was governed by the rate constant KG, which was inhibited by calories in the upper small intestine (SI) (dark blue). KUL was the rate constant of calories disappearance from the upper SI, KDJ from the duodenum, and KJI from the upper jejunum. Nutrients and calories also disappeared in a nonlinear manner, RAMAX describing the maximal rate of their absorption and KM the potency of their absorption. The acetaminophen model (light blue) was characterized by the absorption rate constant (KA), the clearance (CL), central (VC), and peripheral volumes (VP) of distribution and intercompartmental clearance (Q). The gallbladder volume compartment (dark green) was characterized by a production rate (RprodB) and a release rate constant (KRB). Nutrients in the duodenum would generate a signal that increased KRB and releasing bile into the upper SI (light gray, compartment added for illustration purpose). Likewise, nutrients in the duodenum and upper jejunum would generate a signal that respectively released the CCKF and CCKL from the pools. Production of CCKF and CCKL were mediated by the rates RprodF and RprodL. The release from the pools to the plasma was controlled by the release rate constant KRF and KRL, on which the nutrient signal would act. Finally, the disappearance of CCK from the plasma was controlled by the disappearance rate constants KoutF and KoutL.
Figure 2
Figure 2
Visual predictive checks of the acetaminophen plasma concentration (top) and gallbladder volume (bottom) time course and stratified by test drink. For each panel, the median (bold lines), 5th and 95th percentiles (thin lines) of the observed data are compared to the 95% confidence intervals (shaded areas) for the median (light gray), 5th and 95th percentiles of the simulated data (blue/dark gray: acetaminophen, green: gallbladder volume) (based on 1,000 simulations). The external validation of acetaminophen was performed by simulation only. The vertical lines (dashed gray) represent the time of the test drink administration. OGTT, oral glucose tolerance test.
Figure 3
Figure 3
Left: model‐based simulations of the time to empty 50% of the stomach content (TGE50) vs. caloric content stratified by gender and test drink composition. Right: model‐based simulations of the gallbladder ejection fraction vs. the amount of nutrients (differentiation is made between carbohydrates and fats). For each panel different prediction intervals (shaded areas) and the median (solid lines) were calculated based on 1,000 simulations of the development dataset. Dashed lines were added to denote the median T50GE (left) and median gallbladder ejection fraction (right) of the studied test drinks (labels). OGTT, oral glucose tolerance test.

References

    1. Amidon, G.L. , Lennernäs, H. , Shah, V.P. & Crison, J.R. A theoretical basis for a biopharmaceutic drug classification: The correlation of in vitro drug product dissolution and in vivo bioavailability. Pharm. Res. An Off. J. Am. Assoc. Pharm. Sci. 12, 413–420 (1995). - PubMed
    1. Charman, W.N. , Porter, C.J. , Mithani, S. & Dressman, J.B. Physicochemical and physiological mechanisms for the effects of food on drug absorption : The role of lipids and pH. J. Pharm. Sci. 86, 269–282 (1997). - PubMed
    1. Sjögren, E. et al In vivo methods for drug absorption–Comparative physiologies, model selection, correlations with in vitro methods (IVIVC), and applications for formulation/API/excipient characterization including food effects. Eur. J. Pharm. Sci. 57, 99–151 (2014). - PubMed
    1. Camilleri, M. Integrated upper gastrointestinal response to food intake. Gastroenterology 131, 640–58 (2006). - PubMed
    1. Lentz, K.A. Current methods for predicting human food effect. AAPS J. 10, 282–288 (2008). - PMC - PubMed

Publication types

Substances