

Discharge decision-making after complex surgery: Surgeon behaviors compared to predictive modeling to reduce surgical readmissions
- PMID: 28029373
- PMCID: PMC5362294
- DOI: 10.1016/j.amjsurg.2016.03.010
Discharge decision-making after complex surgery: Surgeon behaviors compared to predictive modeling to reduce surgical readmissions
Abstract
Background: Little is known about how information available at discharge affects decision-making and its effect on readmission. We sought to define the association between information used for discharge and patients' subsequent risk of readmission.
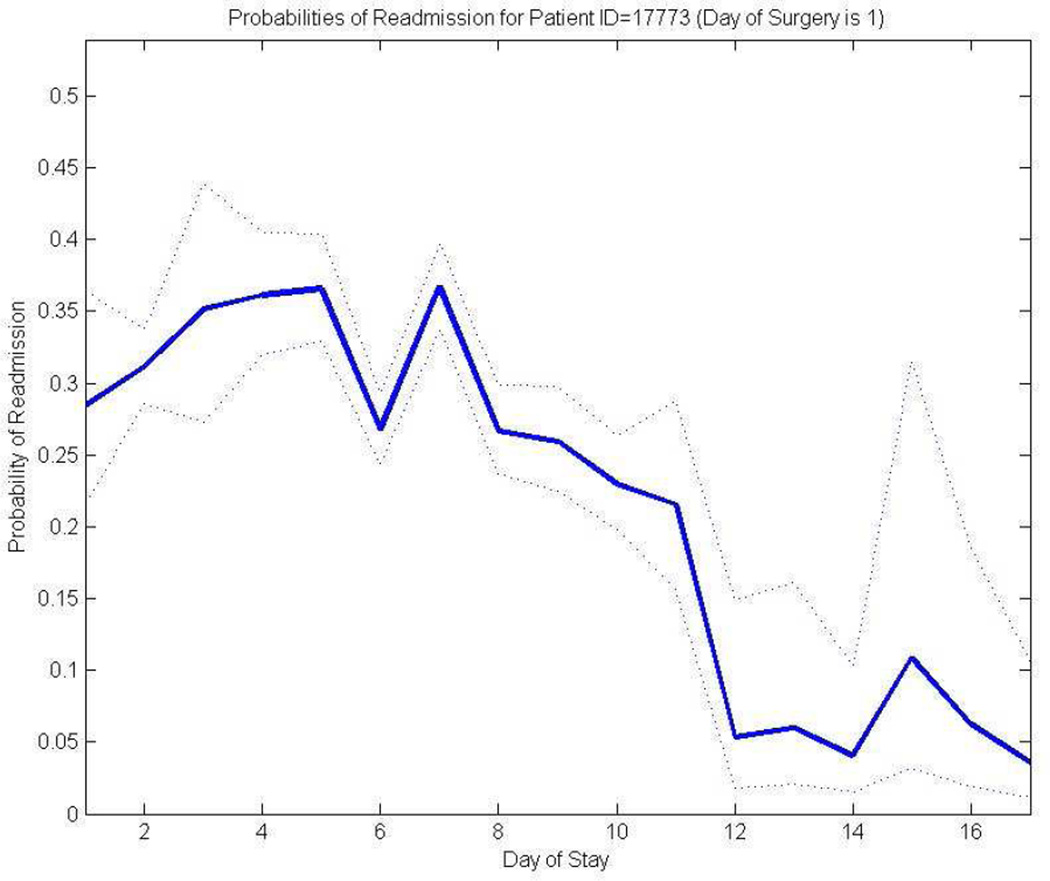
Methods: 2009-2014 patients from a tertiary academic medical center's surgical services were analyzed using a time-to-event model to identify criteria that statistically explained the timing of discharges. The data were subsequently used to develop a time-varying prediction model of unplanned hospital readmissions. These models were validated and statistically compared.
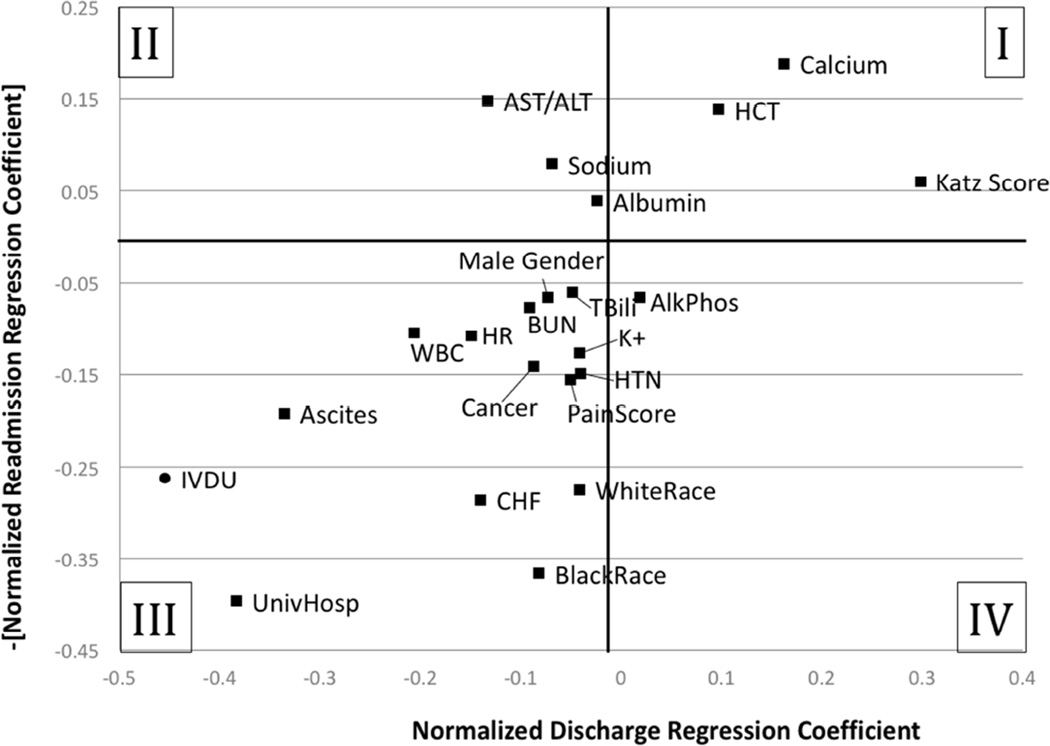
Results: The predictive discharge and readmission regression models were generated from a database of 20,970 patients totaling 115,976 patient-days with 1,565 readmissions (7.5%). 22 daily clinical measures were significant in both regression models. Both models demonstrated good discrimination (C statistic = 0.8 for all models). Comparison of discharge behaviors versus the predictive readmission model suggested important discordance with certain clinical measures (e.g., demographics, laboratory values) not being accounted for to optimize discharges.
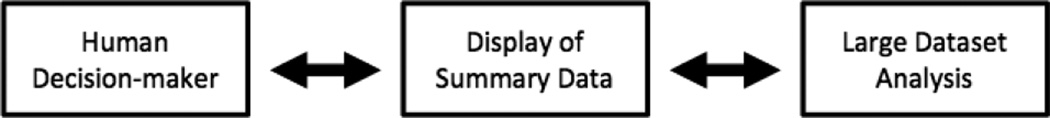
Conclusions: Decision-support tools for discharge may utilize variables that are not routinely considered by healthcare providers. How providers will then respond to these atypical findings may affect implementation.
Keywords: Computer-assisted decision-making; Decision support; Hospital readmission; Logit model.
Copyright © 2016 Elsevier Inc. All rights reserved.
Conflict of interest statement
Figures
References
-
- Jencks SF, Williams MV, Coleman EA. Rehospitalizations among patients in the Medicare fee-for-service program. N Engl J Med. 2009 Apr 2;360(14):1418–1428. PubMed PMID: 19339721. Epub 2009/04/03.eng. - PubMed
-
- Dawes AJ, Sacks GD, Russell MM, et al. Preventable readmissions to surgical services: lessons learned and targets for improvement. J Am Coll Surg. 2014 Sep;219(3):382–389. PubMed PMID: 24891209. - PubMed
-
- Centers for Medicare and Medicaid Services. Medicare & Medicaid Statistical Supplement. Baltimore: 2007.
-
- Office of Legislative Counsel. Compilation of the Patient Protection and Affordable Care Act. United States of America: U.S. House of Representatives; 2010.
-
- Horwitz L, Partovian C, Lin Z, et al. Yale New Haven Health Services Corporation Center for Outcomes Research and Evaluatio. Baltimore: Centers for Medicare and Medicaid; 2011. Hospital-wide (all condition) 30-day risk-standardized readmission measure: draft measure methodology report.
Publication types
MeSH terms
Grants and funding
LinkOut - more resources
Full Text Sources
Other Literature Sources
Medical
