. 2017 Jan-Feb;10(1):106-115.
doi: 10.1016/j.brs.2016.09.008. Epub 2016 Oct 5.

Pulse Duration as Well as Current Direction Determines the Specificity of Transcranial Magnetic Stimulation of Motor Cortex during Contraction

Affiliations

Pulse Duration as Well as Current Direction Determines the Specificity of Transcranial Magnetic Stimulation of Motor Cortex during Contraction

Ricci Hannah et al. Brain Stimul. 2017 Jan-Feb.

Abstract

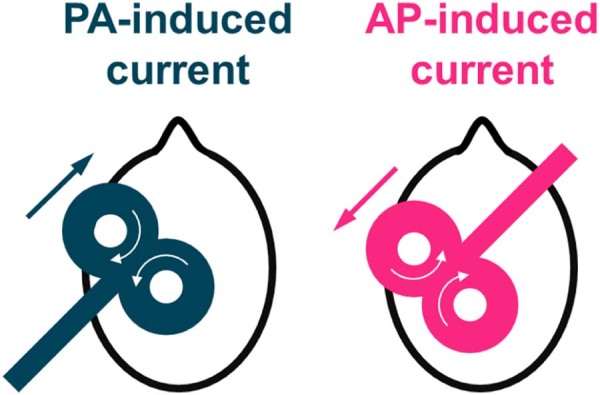
Background: Previous research suggested that anterior-posterior (AP) directed currents induced by TMS in motor cortex (M1) activate interneuron circuits different from those activated by posterior-anterior currents (PA). The present experiments provide evidence that pulse duration also determines the activation of specific interneuron circuits.

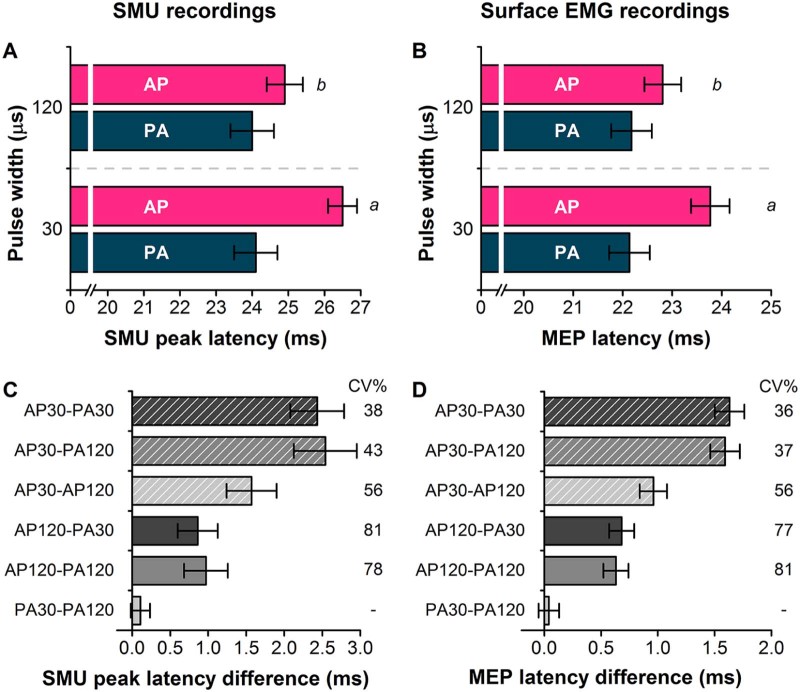
Objective: To use single motor unit (SMU) recordings to confirm the difference in onset latencies of motor-evoked potentials (MEPs) evoked by different current directions and pulse durations: AP30, AP120, PA30 and PA120. To test whether the amplitude of the MEPs is differentially influenced by somatosensory inputs from the hand (short-latency afferent inhibition, SAI), and examine the sensitivity of SAI to changes in cerebellar excitability produced by direct current stimulation (tDCSCb).

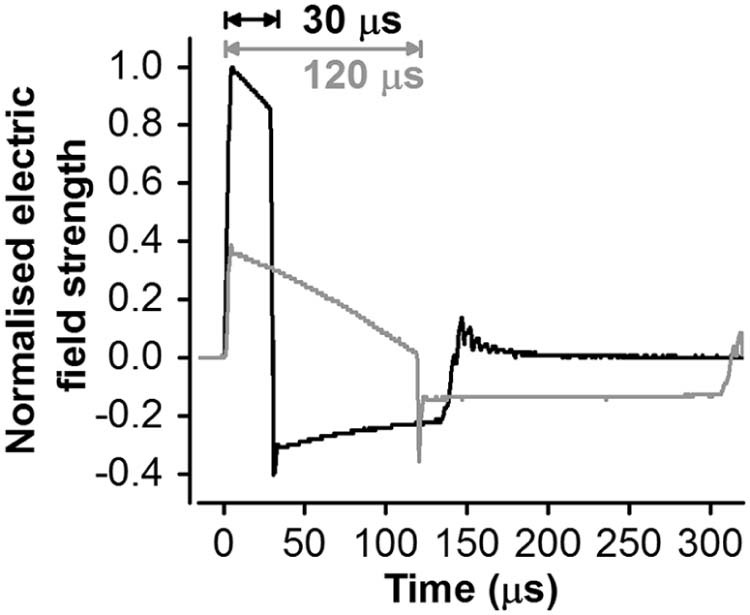
Methods: Surface electromyograms and SMUs were recorded from the first dorsal interosseous muscle. SAI was tested with an electrical stimulus to median or digital nerves ~20-25 ms prior to TMS delivered over the M1 hand area via a controllable pulse parameter TMS (cTMS) device. SAI was also tested during the application of anodal or sham tDCSCb. Because TMS pulse specificity is greatest at low stimulus intensities, most experiments were conducted with weak voluntary contraction to reduce stimulus threshold.

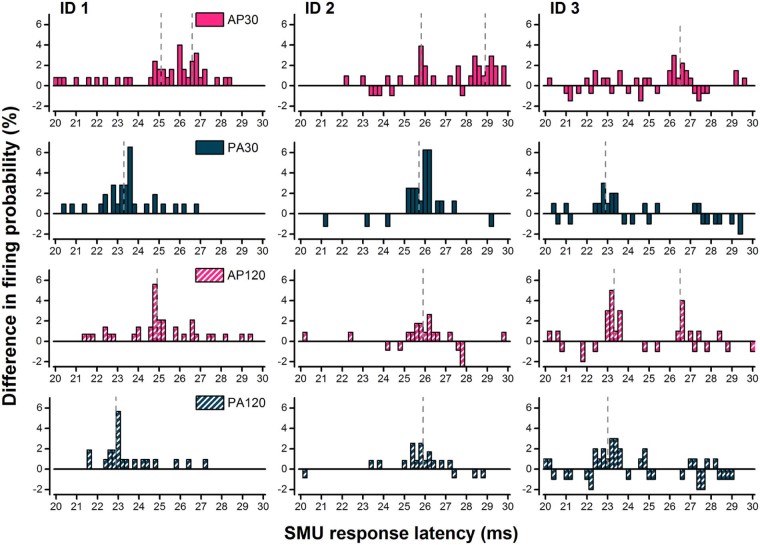
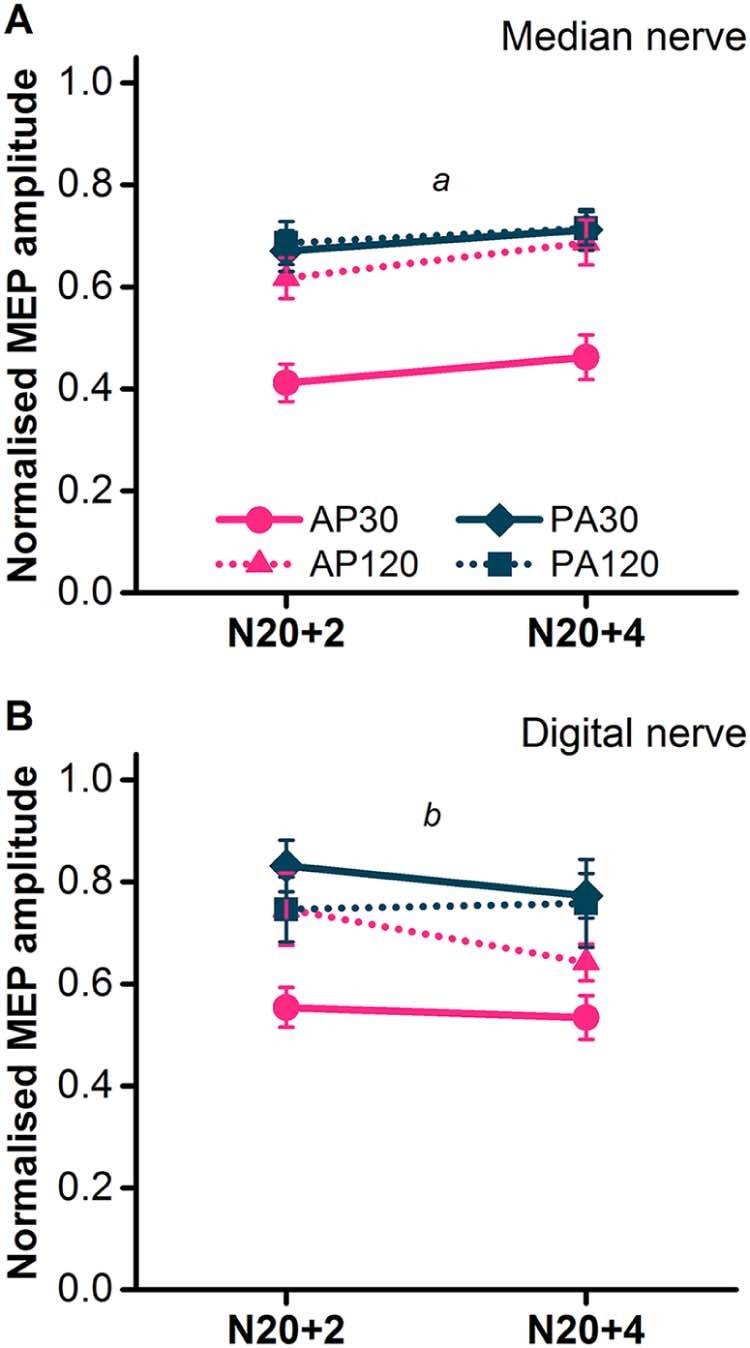
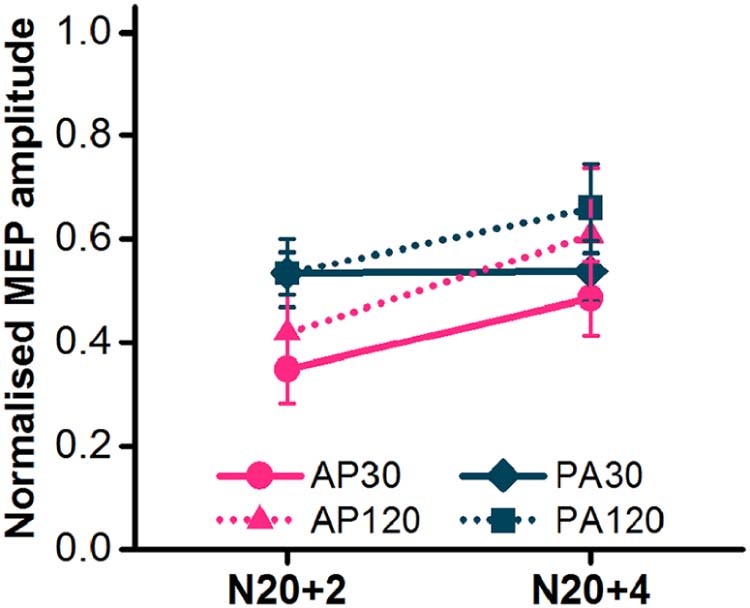
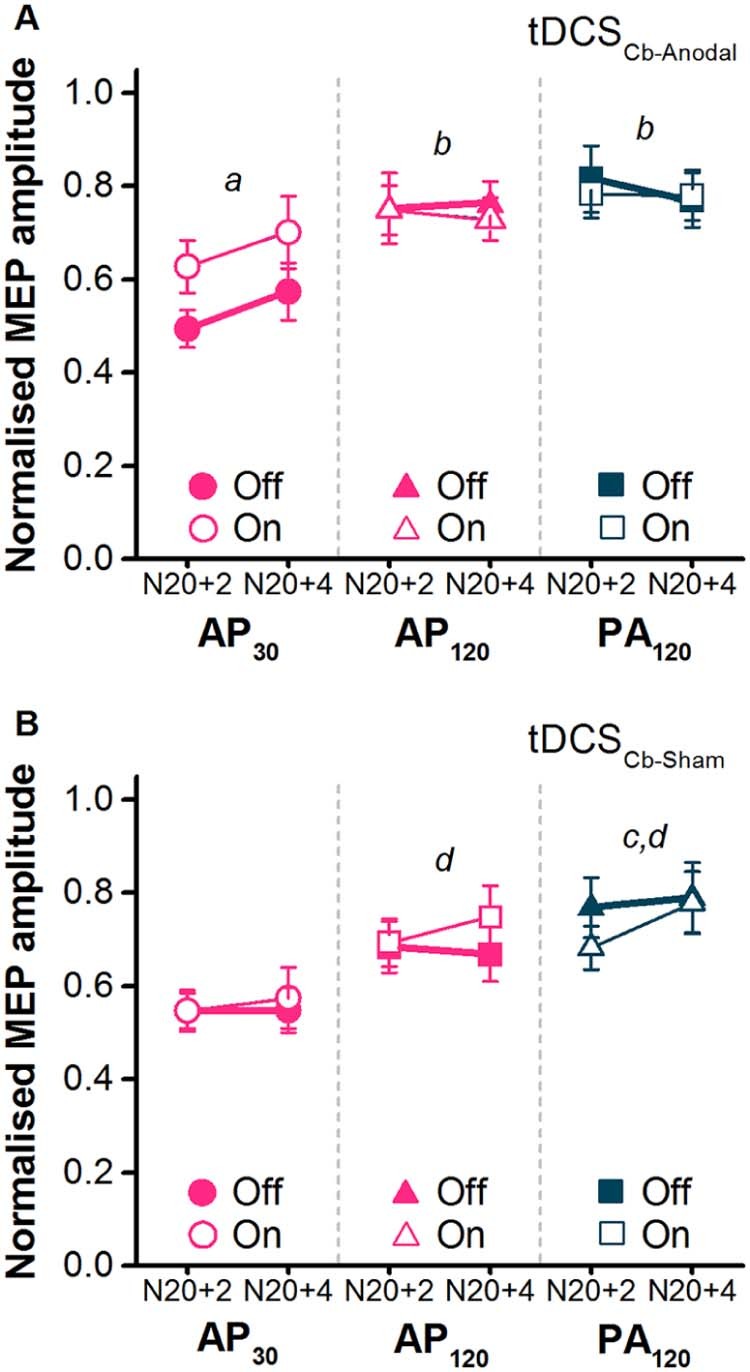
Results: AP30 currents recruited the longest latency SMU and surface MEP responses. During contraction SAI was greater for AP30 responses versus all other pulses. Online anodal tDCSCb reduced SAI for the AP30 currents only.

Conclusions: AP30 currents activate an interneuron circuit with functional properties different from those activated by other pulse types. Pulse duration and current direction determine what is activated in M1 with TMS.

Keywords: Cerebellum; Current direction; Pulse duration; Short latency afferent inhibition; Transcranial direct current stimulation.


Figures

Figure 1
Figure 1
A schematic representation of the TMS coil orientations used. Straight arrows indicate the direction of the current induced in the brain, whilst curved arrows indicate the direction of current in the TMS coil. Posterior–anterior (PA) induced currents in the brain were produced by the coil being oriented posterolaterally at an angle of ~45° to the midline, and anterior–posterior (AP) induced currents in the brain were elicited by placing the coil 180° to the PA currents , , , , .
Figure 2
Figure 2
cTMS electric field pulse waveforms for pulse durations of 30 and 120 µs, referring to the duration of the first dominant phase of the electric field, recorded with a search coil and normalised to the maximum amplitude recorded with the 30 µs pulse. The pulse amplitude was limited by the cTMS device to 100 and 37 percent of maximum amplitude for 30 and 120 µs pulses, respectively , .
Figure 3
Figure 3
Post-stimulus time histograms (PSTH) for three individuals (each shown in a different column: ID 1, ID 2, ID 3) constructed from the difference between control PSTH (pre-stimulus; not shown) and TMS-evoked PSTH and normalised to the number of trigger pulses. The x-axis indicates the time after the TMS stimulus and the y-axis indicates the difference in firing probability between the two PSTHs. 1st row relates to AP30, 2nd row to PA30, 3rd to AP120 and 4th to PA120 currents. Note dashed grey lines indicate the latency of identified peaks. AP30 currents generally evoked a peak ~3 ms later than the earliest peak evoked by PA currents, though it was sometimes accompanied by an earlier peak (see ID 1 and ID 2).
Figure 4
Figure 4
Mean latency of SMU peaks (A; Exp 1), surface EMG recorded MEP latencies (B; Exp 2), mean difference in SMU peak latencies (C; Exp 1), and surface EMG MEP latency differences (D; Exp 2). Follow up t-tests: a, P <0.001 AP30 versus all other pulses; b, P <0.001 AP120 versus PA30 and PA120. Inter-individual coefficient of variation (calculated as mean/SD ×100; CV%) shown for SMU peak and MEP latencies (C and D), except for PA30–PA120 where latency differences close to zero result in extremely large CV%.
Figure 5
Figure 5
SAI assessed in the FDI during slight voluntary contraction (~10% maximum EMG) with median nerve (A; N = 21) and digital nerve conditioning stimuli (B; N = 11). N20+2 and N20+4 refer to the interval between the conditioning stimulus and test stimulus. Follow up t-tests: a, P <0.001 for AP30 versus all other pulses (mean of N20+2 and N20+4), b, P <0.01 for AP30 versus AP120 and PA30 (mean of N20+2 and N20+4).
Figure 6
Figure 6
SAI assessed in the FDI at rest with median nerve conditioning stimulus (N = 8). N20+2 and N20+4 refer to the interval between the conditioning stimulus and test stimulus.
Figure 7
Figure 7
Effects of tDCSCb-Anodal (A) and tDCSCb-Sham (B) on SAI tested with median nerve conditioning stimuli and TMS test pulses comprising of different combinations of pulse duration and current direction (AP30, AP120, PA120). N20+2 and N20+4 refer to the interval between the conditioning stimulus and test stimulus. Off refers to baseline measurements prior to tDCSCb and On refers to measurements during. tDCSCb-Anodal follow up t-tests: a, P <0.05 for AP30 Off versus AP30 On; b, P <0.05 for Off state AP30 versus AP120 and PA120. tDCSCb-Sham follow up t-tests: c, P <0.05 for Off state AP30 versus PA120 (P = 0.065 for AP30 versus AP120); d, P <0.05 for On state AP30 versus PA120 and AP120.

References

    1. Di Lazzaro V., Oliviero A., Profice P., Saturno E., Pilato F., Insola A. Comparison of descending volleys evoked by transcranial magnetic and electric stimulation in conscious humans. Electroencephalogr Clin Neurophysiol. 1998;109(5):397–401. - PubMed
    1. Day B.L., Dressler D., Maertens de Noordhout A., Marsden C.D., Nakashima K., Rothwell J.C. Electric and magnetic stimulation of human motor cortex: surface EMG and single motor unit responses. J Physiol. 1989;412:449–473. - PMC - PubMed
    1. Di Lazzaro V., Oliviero A., Saturno E., Pilato F., Insola A., Mazzone P. The effect on corticospinal volleys of reversing the direction of current induced in the motor cortex by transcranial magnetic stimulation. Exp Brain Res. 2001;138(2):268–273. - PubMed
    1. Di Lazzaro V., Rothwell J.C. Corticospinal activity evoked and modulated by non-invasive stimulation of the intact human motor cortex. J Physiol. 2014;592(Pt 19):4115–4128. - PMC - PubMed
    1. Classen J., Steinfelder B., Liepert J., Stefan K., Celnik P., Cohen L.G. Cutaneomotor integration in humans is somatotopically organized at various levels of the nervous system and is task dependent. Exp Brain Res. 2000;130(1):48–59. - PubMed

LinkOut - more resources