Population genomic analyses reveal a history of range expansion and trait evolution across the native and invaded range of yellow starthistle (Centaurea solstitialis)
- PMID: 28029713
- PMCID: PMC5480294
- DOI: 10.1111/mec.13998
Population genomic analyses reveal a history of range expansion and trait evolution across the native and invaded range of yellow starthistle (Centaurea solstitialis)
Abstract
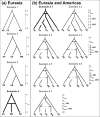
Identifying sources of genetic variation and reconstructing invasion routes for non-native introduced species is central to understanding the circumstances under which they may evolve increased invasiveness. In this study, we used genome-wide single nucleotide polymorphisms to study the colonization history of Centaurea solstitialis in its native range in Eurasia and invasions into the Americas. We leveraged this information to pinpoint key evolutionary shifts in plant size, a focal trait associated with invasiveness in this species. Our analyses revealed clear population genomic structure of potential source populations in Eurasia, including deep differentiation of a lineage found in the southern Apennine and Balkan Peninsulas and divergence among populations in Asia, eastern Europe and western Europe. We found strongest support for an evolutionary scenario in which western European populations were derived from an ancient admixture event between populations from eastern Europe and Asia, and subsequently served as the main genetic 'bridgehead' for introductions to the Americas. Introductions to California appear to be from a single source region, and multiple, independent introductions of divergent genotypes likely occurred into the Pacific Northwest. Plant size has evolved significantly at three points during range expansion, including a large size increase in the lineage responsible for the aggressive invasion of the California interior. These results reveal a long history of colonization, admixture and trait evolution in C. solstitialis, and suggest routes for improving evidence-based management decisions for one of the most ecologically and economically damaging invasive species in the western United States.
Keywords: admixture; biological invasion; invasion routes; phylogeography; rapid evolution; restriction site-associated sequencing.
© 2016 John Wiley & Sons Ltd.
Figures


Similar articles
-
Native and Invading Yellow Starthistle (Centaurea solstitialis) Microbiomes Differ in Composition and Diversity of Bacteria.mSphere. 2019 Mar 6;4(2):e00088-19. doi: 10.1128/mSphere.00088-19. mSphere. 2019. PMID: 30842267 Free PMC article.
-
Dispersal pathways and genetic differentiation among worldwide populations of the invasive weed Centaurea solstitialis L. (Asteraceae).PLoS One. 2014 Dec 31;9(12):e114786. doi: 10.1371/journal.pone.0114786. eCollection 2014. PLoS One. 2014. PMID: 25551223 Free PMC article.
-
Chromosome-scale Reference Genome and RAD-based Genetic Map of Yellow Starthistle (Centaurea solstitialis) Reveal Putative Structural Variation and QTL Associated With Invader Traits.Genome Biol Evol. 2024 Dec 4;16(12):evae243. doi: 10.1093/gbe/evae243. Genome Biol Evol. 2024. PMID: 39592405 Free PMC article.
-
The introduction of an invasive weed was not followed by the introduction of ethnobotanical knowledge: a review on the ethnobotany of Centaurea solstitialis L. (Asteraceae).PeerJ. 2023 Jun 7;11:e15489. doi: 10.7717/peerj.15489. eCollection 2023. PeerJ. 2023. PMID: 37304862 Free PMC article. Review.
-
The devil is in the details: genetic variation in introduced populations and its contributions to invasion.Mol Ecol. 2015 May;24(9):2095-111. doi: 10.1111/mec.13183. Epub 2015 Apr 21. Mol Ecol. 2015. PMID: 25846825 Review.
Cited by
-
Genome size variation and evolution during invasive range expansion in an introduced plant.Evol Appl. 2023 Dec 11;17(1):e13624. doi: 10.1111/eva.13624. eCollection 2024 Jan. Evol Appl. 2023. PMID: 38283607 Free PMC article.
-
Genomics reveals the history of a complex plant invasion and improves the management of a biological invasion from the South African-Australian biotic exchange.Ecol Evol. 2022 Aug 23;12(8):e9179. doi: 10.1002/ece3.9179. eCollection 2022 Aug. Ecol Evol. 2022. PMID: 36016815 Free PMC article.
-
Genetic Diversity and Thermal Performance in Invasive and Native Populations of African Fig Flies.Mol Biol Evol. 2020 Jul 1;37(7):1893-1906. doi: 10.1093/molbev/msaa050. Mol Biol Evol. 2020. PMID: 32109281 Free PMC article.
-
Potential limits to the benefits of admixture during biological invasion.Mol Ecol. 2019 Jan;28(1):100-113. doi: 10.1111/mec.14958. Epub 2018 Dec 21. Mol Ecol. 2019. PMID: 30485593 Free PMC article.
-
Genetic evidence for plural introduction pathways of the invasive weed Paterson's curse (Echium plantagineum L.) to southern Australia.PLoS One. 2019 Sep 19;14(9):e0222696. doi: 10.1371/journal.pone.0222696. eCollection 2019. PLoS One. 2019. PMID: 31536564 Free PMC article.
References
-
- Abbott RJ. Plant invasions, interspecific hybridization and the evolution of new plant taxa. Trends in Ecology & Evolution. 1992;7:401–405. - PubMed
-
- Behre K-E. The role of man in European vegetation history. In: Huntley B, Webb T III, editors. Handbook of Vegetation Science. Klewer Academic Publishers; Dordrecht, The Netherlands: 1988. pp. 633–672.
-
- Bock DG, Caseys C, Cousens RD, et al. What we still don’t know about invasion genetics. Molecular Ecology. 2015;24:2277–2297. - PubMed
MeSH terms
Grants and funding
LinkOut - more resources
Full Text Sources
Other Literature Sources

