. 2016 Dec 28;11(12):e0168333.
doi: 10.1371/journal.pone.0168333. eCollection 2016.

Phase-Shift Dynamics of Sea Urchin Overgrazing on Nutrified Reefs

Affiliations

Phase-Shift Dynamics of Sea Urchin Overgrazing on Nutrified Reefs

Nina Kriegisch et al. PLoS One. .

Abstract

Shifts from productive kelp beds to impoverished sea urchin barrens occur globally and represent a wholesale change to the ecology of sub-tidal temperate reefs. Although the theory of shifts between alternative stable states is well advanced, there are few field studies detailing the dynamics of these kinds of transitions. In this study, sea urchin herbivory (a 'top-down' driver of ecosystems) was manipulated over 12 months to estimate (1) the sea urchin density at which kelp beds collapse to sea urchin barrens, and (2) the minimum sea urchin density required to maintain urchin barrens on experimental reefs in the urbanised Port Phillip Bay, Australia. In parallel, the role of one of the 'bottom-up' drivers of ecosystem structure was examined by (3) manipulating local nutrient levels and thus attempting to alter primary production on the experimental reefs. It was found that densities of 8 or more urchins m-2 (≥ 427 g m-2 biomass) lead to complete overgrazing of kelp beds while kelp bed recovery occurred when densities were reduced to ≤ 4 urchins m-2 (≤ 213 g m-2 biomass). This experiment provided further insight into the dynamics of transition between urchin barrens and kelp beds by exploring possible tipping-points which in this system can be found between 4 and 8 urchins m-2 (213 and 427 g m-2 respectively). Local enhancement of nutrient loading did not change the urchin density required for overgrazing or kelp bed recovery, as algal growth was not affected by nutrient enhancement.


Conflict of interest statement

The authors have declared that no competing interests exist.

Figures

Fig 1
Fig 1. Kelp collapse and recovery at different urchin densities over time.
Percentage cover of canopy-forming algae at a range of sea urchin densities (individuals m-²) on patch reefs initiated as the ‘kelp bed’ (a) and (b), and ‘barrens’ state (c) and (d) in northern Port Phillip Bay, Nov. 2012 to Dec. 2013. Plots (a) and (c) represent reefs with ambient nutrient levels, and (b) and (d) show results for reefs with enhanced nutrient levels.
Fig 2
Fig 2. E. radiata recruitment.
Abundance (mean ± SE) of E. radiata recruits on reefs above and below the critical urchin density (4 urchins m-2) for kelp recovery after 13 months (‘Kelp’ and ‘Barrens’ refers to the initial states of reefs). Nutrient enhancement did not influence recruitment and therefore data for ‘nutrient enhanced’ and ‘ambient nutrient’ reefs were pooled for display.
Fig 3
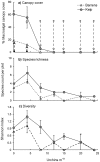
Fig 3. Dependence of algal species richness and diversity on canopy cover.
Panel a) details cover of canopy-forming algae, b) shows macroalgal species richness, and c) macroalgal species diversity, against sea urchin densities at the end of the 13 month experimental period. Reefs with initial states of ‘kelp bed’ and ‘urchin’ barrens’ are indicated by a grey circle and a white triangle respectively; data are means ± SE. Reefs with enhanced nutrients have been pooled with reefs with ambient nutrient conditions since the addition of fertiliser did not influence response variables (see Tables 2 and 3). Note that species present at the start of the experiment (E. radiata for kelp bed reefs and encrusting red algae for all reefs) were excluded from the analysis. Arrows in (a) show responses to experimental manipulation of sea urchin biomass in kelp beds (thick grey arrows = forward-shift ‘collapse’ from kelp to urchin barrens) and on sea urchin barrens (thin black arrows = reverse-shift ‘recovery’ from urchin barrens back to kelp beds).
Fig 4
Fig 4. Percentage cover of turf-forming algae versus cover of canopy-formers.
Open circles display reefs with ambient nutrient conditions and filled circles are reefs with enhanced nutrient levels across all experimental patch reefs at the conclusion of the 13 months experiment (the treatment of ‘reef state’ is not indicated). Fitted line represents treatments pooled across ambient and enhanced nutrient reefs (R² = 0.75, y = -0.056x + 4.16, values derived from linear regression with transformation ln(Y)) because a 1-way ANCOVA showed no significant difference in relationships between reefs with enhanced nutrients and those with ambient nutrient levels (homogeneity of slopes: F1,24 = 0.85, P = 0.36; test between treatments after factoring for the covariate, F1,25 = 1.00, P = 0.33).

Similar articles

Cited by

References

    1. Posey MH, Alphin TD, Cahoon LB, Lindquist DG, Mallin MA, et al. (2002) Top-down versus bottom-up limitation in benthic infaunal communities: Direct and indirect effects. Estuaries 25: 999–1014.
    1. Burkepile DE, Hay ME (2006) Herbivore vs. nutrient control of marine primary producers: Context-dependent effects. Ecology 87: 3128–3139. - PubMed
    1. Beisner BE, Haydon DT, Cuddington K (2003) Alternative stable states in ecology. Frontiers in Ecology and the Environment 1: 376–382.
    1. Collie JS, Richardson K, Steele JH (2004) Regime shifts: can ecological theory illuminate the mechanisms? Progress in Oceanography 60: 281–302.
    1. May RM (1977) Thresholds and breaking points in ecosystems with a multiplicity of stable states. Nature 269: 471–477.