. 2017 Feb 15;595(4):1315-1337.
doi: 10.1113/JP273272. Epub 2016 Dec 28.

Tonotopic action potential tuning of maturing auditory neurons through endogenous ATP

Affiliations

Tonotopic action potential tuning of maturing auditory neurons through endogenous ATP

Saša Jovanovic et al. J Physiol. .

Abstract

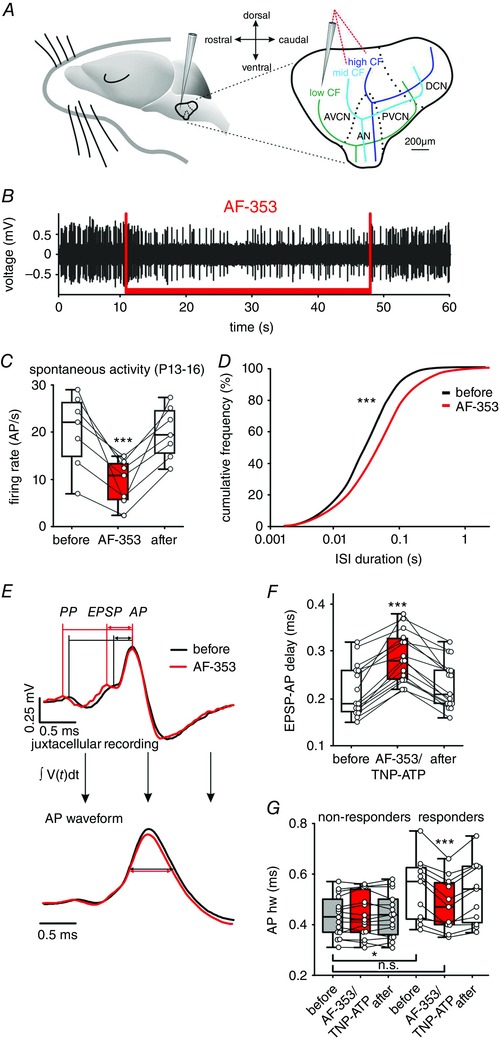
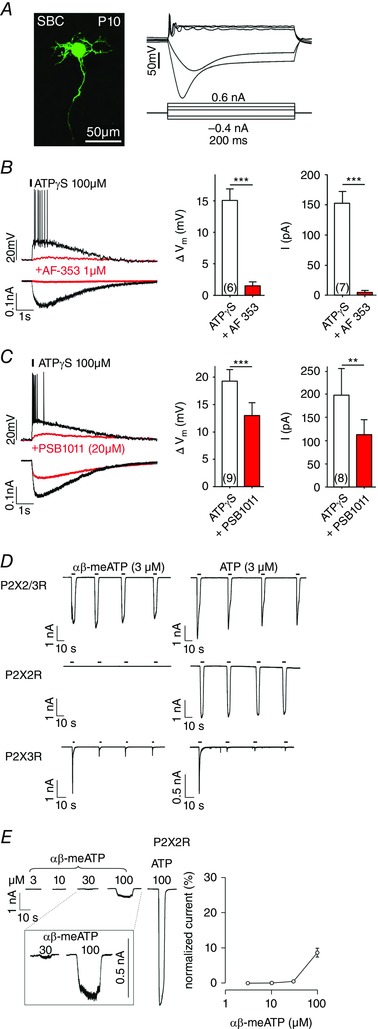
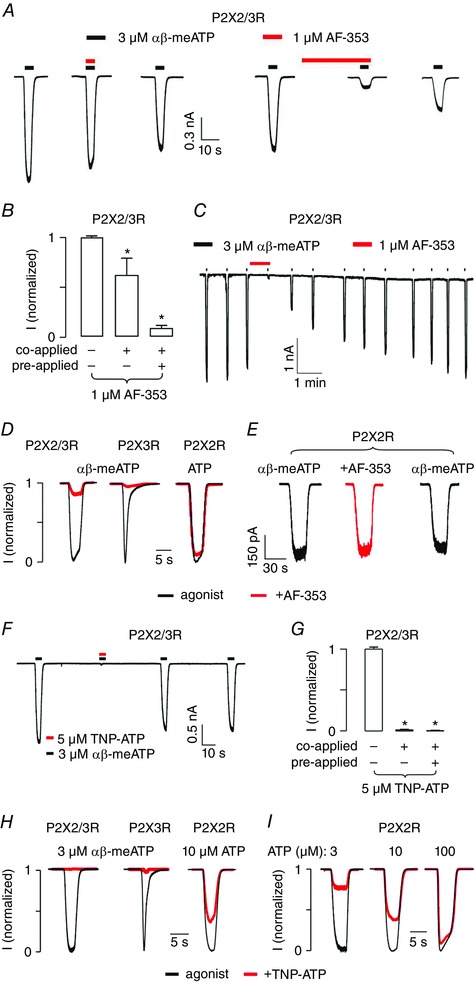
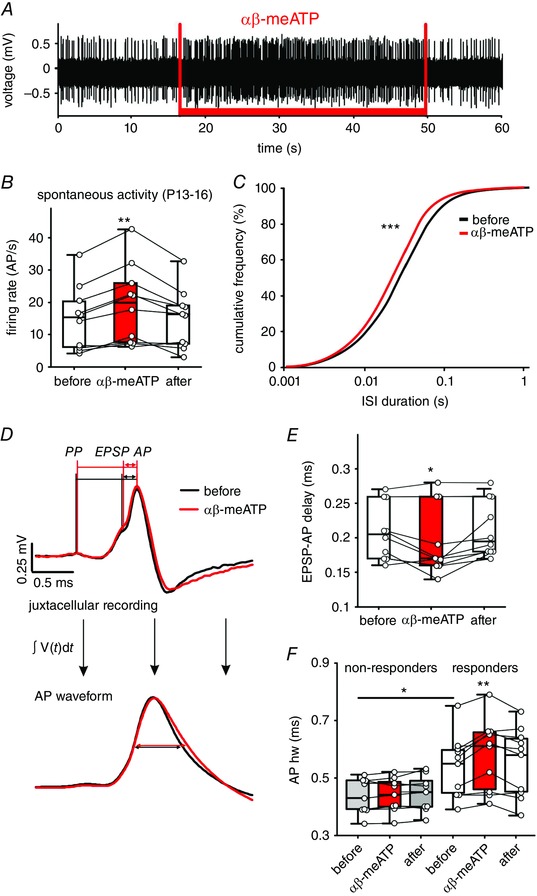
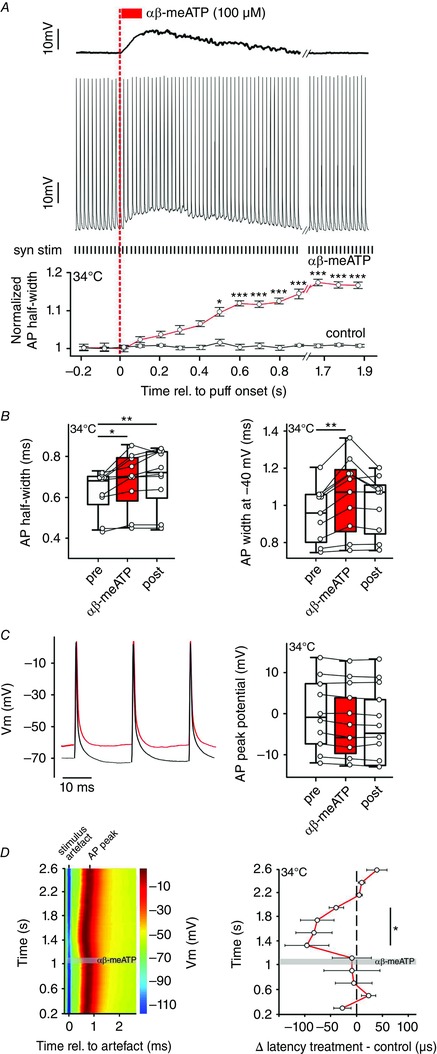
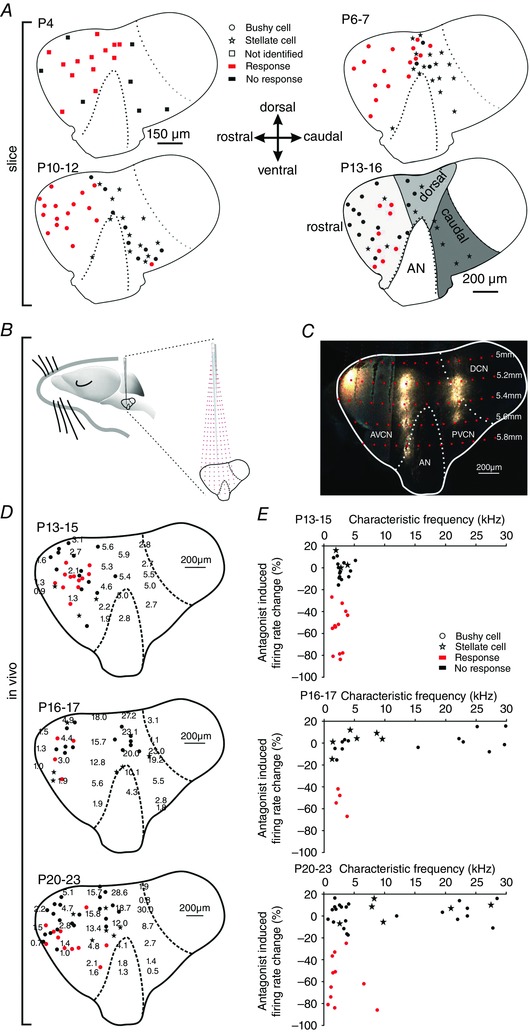
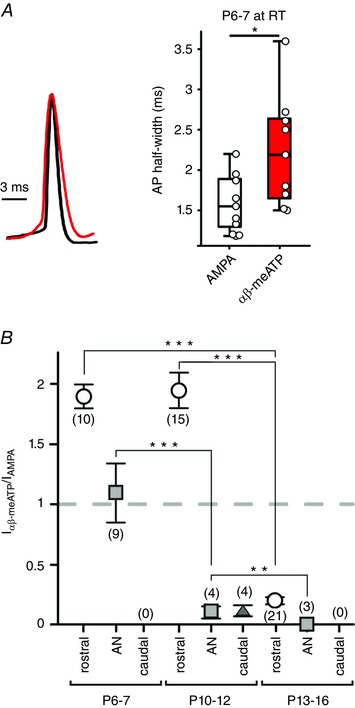
Key points: Following the genetically controlled formation of neuronal circuits, early firing activity guides the development of sensory maps in the auditory, visual and somatosensory system. However, it is not clear whether the activity of central auditory neurons is specifically regulated depending on the position within the sensory map. In the ventral cochlear nucleus, the first central station along the auditory pathway, we describe a mechanism through which paracrine ATP signalling enhances firing in a cell-specific and tonotopically-determined manner. Developmental down-regulation of P2X2/3R currents along the tonotopic axis occurs simultaneously with an increase in AMPA receptor currents, suggesting a high-to-low frequency maturation pattern. Facilitated action potential (AP) generation, measured as higher firing rate, shorter EPSP-AP delay in vivo and shorter AP latency in slice experiments, is consistent with increased synaptic efficacy caused by ATP. The long lasting change in intrinsic neuronal excitability is mediated by the heteromeric P2X2/3 receptors.

Abstract: Synaptic refinement and strengthening are activity-dependent processes that establish orderly arranged cochleotopic maps throughout the central auditory system. The maturation of auditory brainstem circuits is guided by action potentials (APs) arising from the inner hair cells in the developing cochlea. The AP firing of developing central auditory neurons can be modulated by paracrine ATP signalling, as shown for the cochlear nucleus bushy cells and principal neurons in the medial nucleus of the trapezoid body. However, it is not clear whether neuronal activity may be specifically regulated with respect to the nuclear tonotopic position (i.e. sound frequency selectivity). Using slice recordings before hearing onset and in vivo recordings with iontophoretic drug applications after hearing onset, we show that cell-specific purinergic modulation follows a precise tonotopic pattern in the ventral cochlear nucleus of developing gerbils. In high-frequency regions, ATP responsiveness diminished before hearing onset. In low-to-mid frequency regions, ATP modulation persisted after hearing onset in a subset of low-frequency bushy cells (characteristic frequency< 10 kHz). Down-regulation of P2X2/3R currents along the tonotopic axis occurs simultaneously with an increase in AMPA receptor currents, thus suggesting a high-to-low frequency maturation pattern. Facilitated AP generation, measured as higher firing frequency, shorter EPSP-AP delay in vivo, and shorter AP latency in slice experiments, is consistent with increased synaptic efficacy caused by ATP. Finally, by combining recordings and pharmacology in vivo, in slices, and in human embryonic kidney 293 cells, it was shown that the long lasting change in intrinsic neuronal excitability is mediated by the P2X2/3R.

Keywords: AP modulation; ATP release; P2X2/X3 receptor; auditory brainstem; calyceal synapses; development.


Figures

Figure 1
Figure 1. Endogenous activation of P2X3R or P2X2/3R contributes to in vivo firing activity of bushy cells from P13–16
A, schematic drawing of the parasaggital view to the CN complex with gross representations of characteristic frequencies of neurons. Note the dorso‐caudal to rostro‐ventral high‐to‐low tonotopic axis. Red dashed lines show recording electrode trajectories targeting different positions within the CN. B, trace of juxtacellularly recorded APs shows a reduction of firing rate during the application of the P2X3R and P2X2/3R antagonist AF‐353 (1 mm; red bar). C, summary of the reversible AF‐353 inhibition of spontaneous firing in seven BCs (circles); box‐plots show medians, the 25 and 75 percentiles, and the interdecile ranges (*** P < 0.001, RM ANOVA). D, cumulative distribution of ISIs for the same seven cells before (black) and during (red), AF‐353 application (*** P < 0.001, Kolmogorov–Smirnov test). E, top: mean waveforms of 245 juxtacellularly recorded APs under control condition (black) and of 141 APs during AF‐353 application (red). The wave forms are aligned at the peak of APs. Note that AF‐353 application prolongs the EPSP‐AP transition time but not the PP‐EPSP time. Bottom: integral of the mean AP waveforms of the signals shown above. Horizontal lines show the narrower APhw during AF‐353 application. F, summary data showing a reversible prolongation of EPSP‐AP transition time as an effect of P2X3R or P2X2/3R antagonists AF‐353 or TNP‐ATP (*** P < 0.001, RM ANOVA). G, in BCs showing reduction of spontaneous AP firing upon AF‐353 or TNP‐ATP (responders), the application also caused a reversible reduction of APhw (white/red box‐plots; *** P < 0.001, two‐way ANOVA). Prior to antagonist application, the APhw in responder cells was longer than in non‐responder cells (white vs. grey box‐plots, * P < 0.05, two‐way ANOVA). Note the similar APhw values between the responder cells under antagonist and non‐responder cells (red responder vs. grey box‐plots). [Colour figure can be viewed at wileyonlinelibrary.com]
Figure 2
Figure 2. Characterization of the native P2XR by comparison of responses in bushy cells and in HEK293 cells expressing homomeric P2X2R, P2X3R and heteromeric P2X2/3R
A, BCs from P10–12 were characterized by the post hoc labelling of biocytin‐filled neurons (left), phasic firing after supra‐threshold depolarization, and the prominent sag after hyperpolarizing current steps (right). B, left: voltage and current responses of the cell shown in (A) to a puff application of ATPγS (150 ms, 2 psi, 20 μm from cell soma), before (black) and after superfusion of AF‐353 (red). The responses were evoked from V h  = −60 mV. Right: summary data for the inhibitory effect of AF‐353 on the ATPγS‐induced membrane depolarization and current. C, limited inhibitory potency of the P2X2 antagonist PSB1011. Even at the PSB1011 concentration of 20 μm, the responses to ATPγS were only partially inhibited (** P < 0.01, *** P < 0.001, paired t test). Cell numbers are given in parentheses. D, whole‐cell current responses during repetitive agonist applications in HEK293 cells co‐expressing P2X2R and P2X3R (top row), P2X2R (middle row) or P2X3R (bottom row). Cells were stimulated for 5 s with 3 μm αβ‐meATP (left column) or 3 μm ATP (right column). Note that the P2X2R did not respond to 3 μm αβ‐meATP, whereas the P2X3R current highly desensitized after the first application of αβ‐meATP or ATP. This indicates that agonist‐induced currents in cells co‐expressing P2X2R and P2X3R were gated by P2X2/3R heteromers. E, concentration‐dependent effects of αβ‐meATP show a threshold concentration of 30 μm for activation of P2X2R. Left: representative traces obtained from the same cell stimulated with increasing agonist concentrations for 10 s. The last recording shows the response to 100 μm ATP. Inset: magnification of currents gated by 30 and 100 μm αβ‐meATP. Right: currents elicited by αβ‐meATP were normalized against the response evoked by 100 μm ATP (mean ± SEM, n = 4). [Colour figure can be viewed at wileyonlinelibrary.com]
Figure 3
Figure 3. Receptor‐specific effects of AF‐353 and TNP‐ATP on P2XR currents
A, representative recordings from a HEK293 cell co‐expressing P2X2 and P2X3R during the second, third and fourth (both panels: left, middle and right, respectively) application of 3 μm αβ‐meATP. In addition, 1 μm AF‐353 (red) was either co‐applied (left panel: middle) or pre‐ and co‐applied (right panel: middle) with the agonist. B, summary of the inhibition induced by 1 μm AF‐353 shows higher effectiveness after pre‐application. C, slow washout of 1 μm AF‐353 (red) after pre‐application for 30 s and co‐application with 3 μm αβ‐meATP. D, selectivity of AF‐353. Black traces represent the responses evoked by 3 μm αβ‐meATP (P2X2/3R and P2X3R) or by 10 μm ATP (P2X2R). Red traces depict current responses from the same cells in the presence of 1 μm AF‐353. AF‐353 was pre‐applied for 30 s and then co‐applied with agonist. E, lack of AF‐353 effect on P2X2R‐mediated currents gated by 100 μm αβ‐meATP. Traces shown are from the same cell during the first (left), second (middle) and third (right) application, with 1 μm AF‐353 pre‐applied for 30 s and then co‐applied with agonist during its second application. In all experiments, duration of agonist application was 5 s. F, representative recordings from a cell co‐expressing P2X2R and P2X3R stimulated with 3 μm αβ‐meATP for 5 s (black). Co‐application of TNP‐ATP (5 μm, red) completely inhibited the current. Beforehand, αβ‐meATP had been applied to desensitize P2X3R‐mediated responses (not shown). G, summary of the inhibition induced by 5 μm TNP‐ATP on P2X2/3R. H, selectivity of TNP‐ATP. Black traces represent the responses evoked by 3 μm αβ‐meATP (P2X2/3R and P2X3R) or 10 μm ATP (P2X2R) and red traces the current responses from the same cells in the presence of 5 μm TNP‐ATP. Duration of agonist application was 5 s and TNP‐ATP was co‐applied with agonist. I, competitive antagonistic effect of TNP‐ATP on ATP‐induced P2X2R currents. Normalized currents gated by 3 (left), 10 (middle) or 100 μm (right) ATP (for 5 s) in the absence (black) or in the presence (red) of 5 μm TNP‐ATP. [Colour figure can be viewed at wileyonlinelibrary.com]
Figure 4
Figure 4. Effects of P2X2/3R activation on APs in vivo
A, juxtacellular recording showing a persistent increase in AP frequency during iontophoretic application of αβ‐meATP (20 mm, red bar). B, changes in spontaneous spiking evoked by αβ‐meATP in 10 BCs and calculated as average firing rate before, during and after drug application. Circles depict individual cells; box‐plots depict the medians, 25 and 75 percentiles, and the interdeciles (** P < 0.01, RM ANOVA). C, ISIs for 10 BCs before (black) and during (red) αβ‐meATP administration shown as cumulative distribution (*** P < 0.001, Kolmogorov–Smirnov test). D, top: mean waveforms from 152 APs before (black) and 232 APs under the αβ‐meATP application (red). Bottom: integrals of AP waveforms from the upper graph. Horizontal lines show the APhw. E, summary data showing a shorter EPSP‐AP transition time caused by αβ‐meATP (* P < 0.05, RM ANOVA). F, cells not responding to αβ‐meATP (non‐responders) have shorter APhw compared to responder cells (grey vs. white box‐plots) (* P < 0.05, two‐way ANOVA). In responder cells, the APhw is further prolonged by αβ‐meATP (red box‐plot) (* P < 0.01, two‐way ANOVA). [Colour figure can be viewed at wileyonlinelibrary.com]
Figure 5
Figure 5. P2X2/3R activation affects temporal properties of APs
A, top: representative voltage trace showing BC depolarization in response to puff application of αβ‐meATP (red bar). Dashed red line indicates the application onset. Middle: simultaneous acquisition of synaptically evoked APs in the same cell by electrical stimulation of the auditory nerve input (50 Hz, black ticks below; syn stim). Bottom: persistent prolongation of APhw reached significance after 0.45 s (red line; * P < 0.05, *** P < 0.001, z test). The black line shows normalized APhw of control events, without αβ‐meATP application. Each circle represents an average half‐width for five consecutive APs. B, APhw (left) and the AP width at −40 mV (right) are increased upon application of αβ‐meATP. Box‐plots show medians with 25 and 75 percentiles, and interdeciles for the periods before (pre), during (αβ‐meATP) and after (post) application (* P < 0.05, ** P < 0.01, RM ANOVA). C, left: overlay of APs elicited before (0.86–0.92 s, black) and after the onset of αβ‐meATP application (1.18–1.24 s, red). Right: membrane potential at the peak of AP (n = 10, P = 0.12, one‐way RM ANOVA). D, left: latency changes of APs synaptically evoked at 50 Hz stimulation frequency. The responses were aligned at the stimulus artefact (blue) and the grey area depicts the duration of application. Membrane potential values are colour coded. Note the shorter AP latencies after the αβ‐meATP application. Right: population data showing a long‐lasting decrease in AP latency following the application of αβ‐meATP (circles, red line) compared to control (black dashed line). Circles indicate average latency differences between treatment and control for 10 consecutive APs. Note the significant shortening of latencies during the time window 200–800 ms after the αβ‐meATP application (n = 9, mean ± SEM, one sample t test). [Colour figure can be viewed at wileyonlinelibrary.com]
Figure 6
Figure 6. Purinergic modulation is cell‐specific and dependent on characteristic frequency
A, parasagittal view to the CN of P4 (upper left), P6–7 (upper right), P10–12 (lower left), P13–16 (lower right) animals showing the positions of recorded cells. Red symbols indicate cell affected by puff application of αβ‐meATP (responders; *** P < 0.001, z test), black symbols non‐responders; stars show stellate cells. At P4, recorded cells are indicated by squares since they could not be unambiguously characterized as bushy or stellate. Grey areas on the P13–16 slice schematically depict the rostral, dorsal and caudal region. Cells from all ages were sorted accordingly. B, schematic drawing of the experimental approach used for tonotopic mapping in the cochlear nucleus complex. Red dashed lines show electrode trajectories targeting at different positions within the CN, red dots indicate the depth of the electrode penetration. C, parasagittal slice of the gerbil CN labelledin vivo with fluorogold at three rostro‐caudal penetration positions in 200 μm vertical steps. The image was generated by overlaying two medio‐laterally separated slices; the curvature of the CN along the rostro‐caudal axis precludes a visualization of the entire information in one slice. D, distribution of CFs (kHz) in P13–15 (upper panel), P16–17 (middle panel) and P20–23 cells (lower panel). Positions of BCs are indicated by closed circles, stellate cells by stars. Red dots show BCs with significant reduction of spontaneous firing during application of AF‐353 or TNP‐ATP (responders, z > 1.65); black dots show BCs not susceptible to antagonists (non‐responders). E, relative changes in firing rates upon application of P2X2/3R antagonist as a function of the CF of the unit. The effect on BCs depended on the CF of the unit (P16–17: P = 0.011, r s = 0.6; P20–23: P = 0.04, r s = 0.36; Spearman's rank order correlation). Note that none of the stellate cells were susceptible to P2X2/3R antagonists. [Colour figure can be viewed at wileyonlinelibrary.com]
Figure 7
Figure 7. Developmental shift from P2X2/3R‐ to AMPAR‐mediated signalling in the VCN
A, comparison of the APs evoked either by αβ‐meATP‐ or by AMPA‐puff application to P6–7 BCs from the rostral VCN (100  and 50 μm, respectively; both 100 ms). Overlay of peak‐normalized APs (left) and summary data (right) (* P < 0.05, t test). B, responsiveness of BCs with respect to topographic VCN position (rostral‐dots, auditory nerve root region AN, squares; caudal, triangle) and age. Whole‐cell currents evoked in the same cells by separate puff applications of αβ‐meATP and AMPA in saturating concentrations show specific developmental patterns. Note a prominent reduction in I αβ‐meATP/I AMPA ratio occurring before hearing onset in the auditory nerve region (squares) and after hearing onset in the rostral region (dots). In the caudal region, αβ‐meATP response was either very weak (triangle) or completely missing. Numbers of cells are given in parentheses. No responder BCs were found in the caudal VCN indicated by (0) (** P < 0.01, *** P < 0.001 two‐way ANOVA). [Colour figure can be viewed at wileyonlinelibrary.com]

Comment in

References

    1. Abbott LF & Nelson SB (2000). Synaptic plasticity: taming the beast. Nat Neurosci 3, 1178–1183. - PubMed
    1. Anderson‐Sprecher R (1994). Model comparisons and R 2 . AmStat 48, 113–117.
    1. Aponte JE, Kotak VC & Sanes DH (1996). Decreased synaptic inhibition leads to dendritic hypertrophy prior to the onset of hearing. AudNeurosci 2, 235–240.
    1. Baqi Y, Hausmann R, Rosefort C, Rettinger J, Schmalzing G & Müller CE (2011). Discovery of potent competitive antagonists and positive modulators of the P2X2 receptor. J Med Chem 54, 817–830. - PubMed
    1. Bean BP (2007). The action potential in mammalian central neurons. Nat Rev Neurosci 8, 451–465. - PubMed

Publication types

MeSH terms

LinkOut - more resources