. 2017 Mar 7;8(10):16340-16355.
doi: 10.18632/oncotarget.14092.

The embryonic type of SPP1 transcriptional regulation is re-activated in glioblastoma

Affiliations

The embryonic type of SPP1 transcriptional regulation is re-activated in glioblastoma

Magdalena Kijewska et al. Oncotarget. .

Abstract

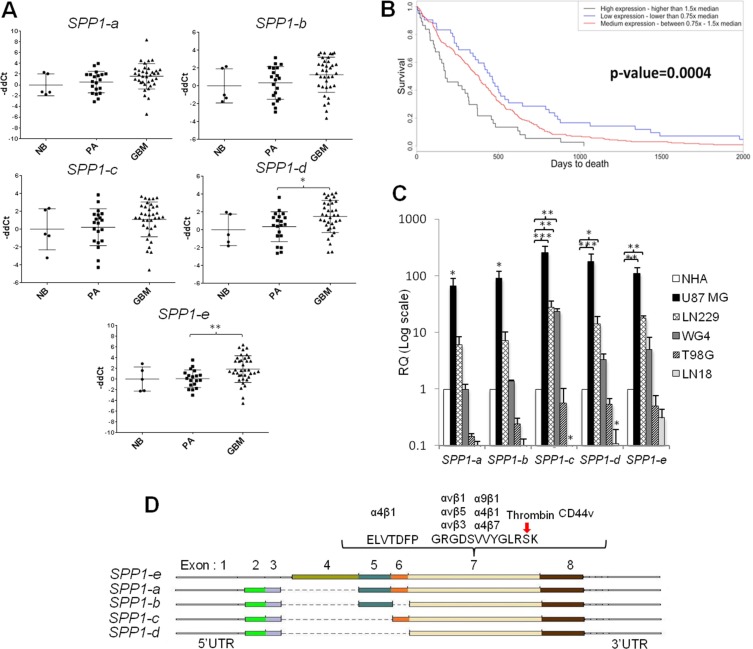
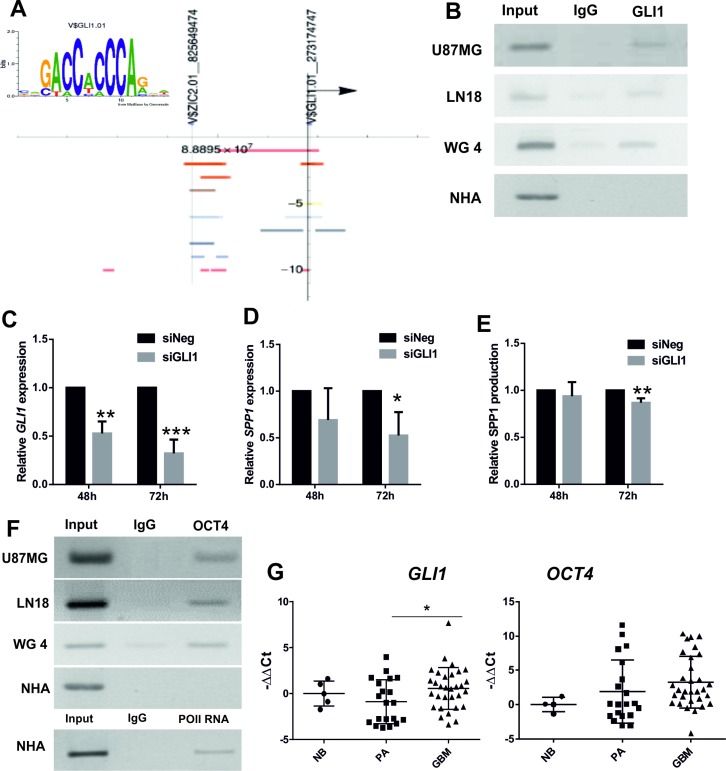
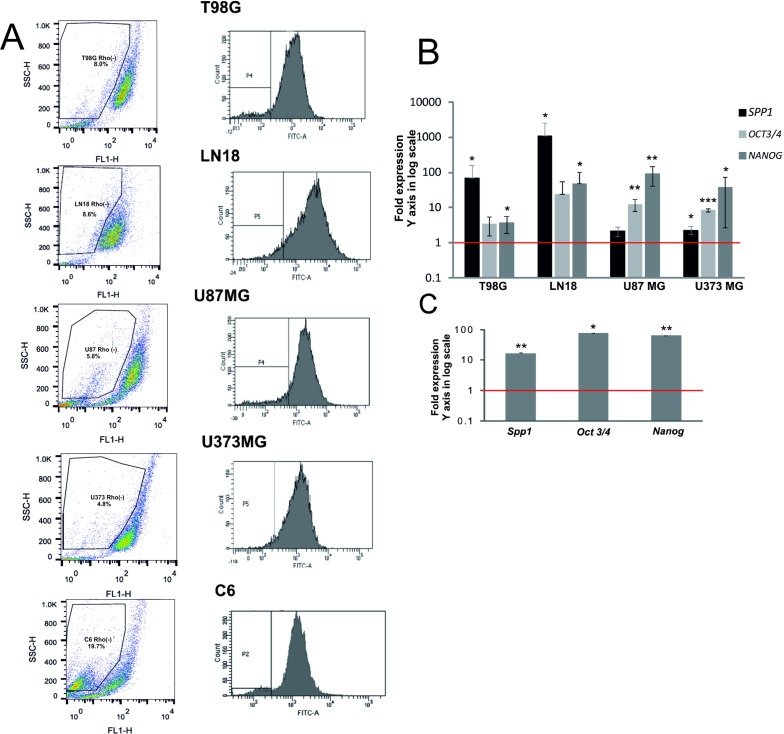
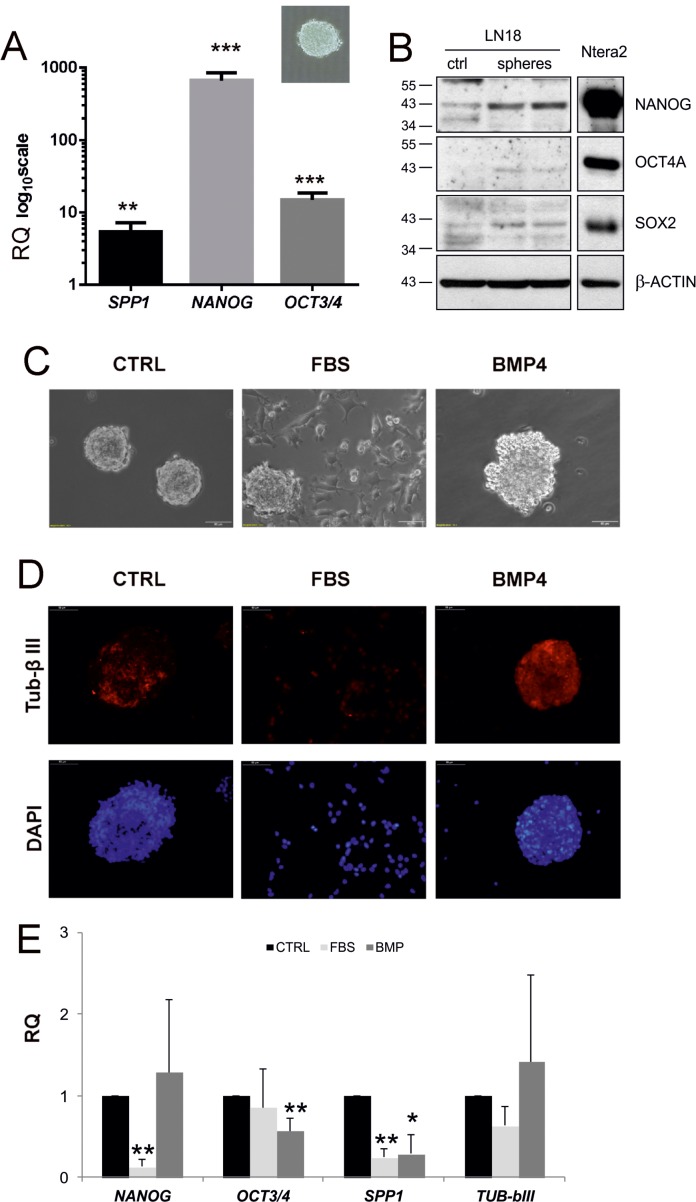
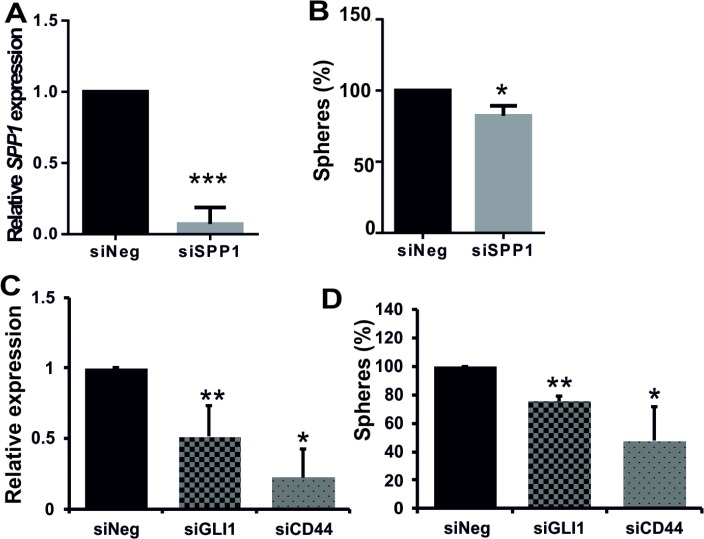
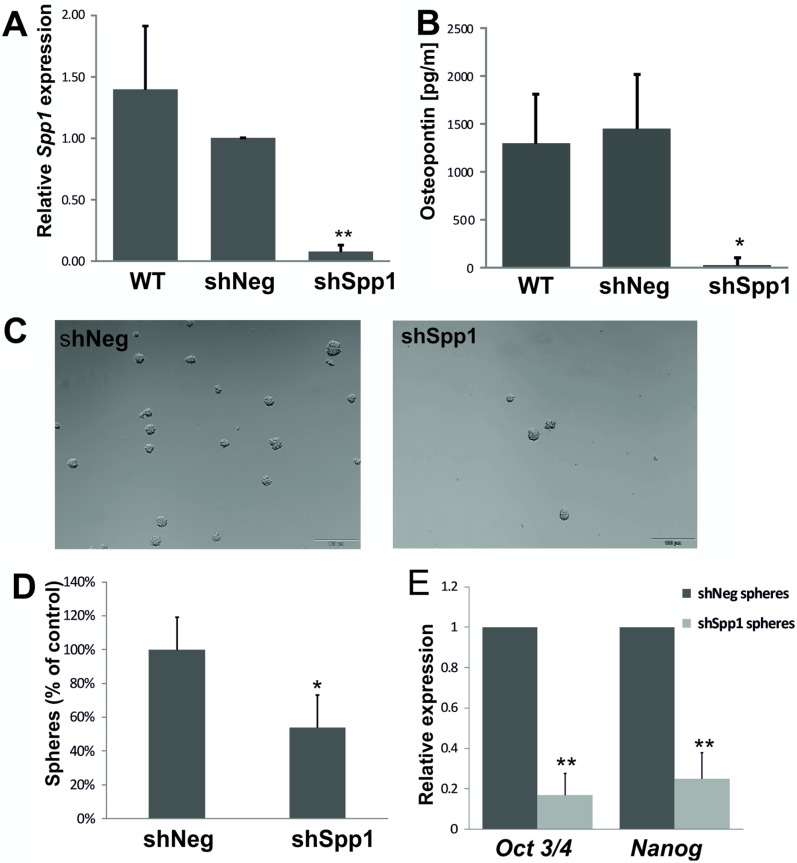
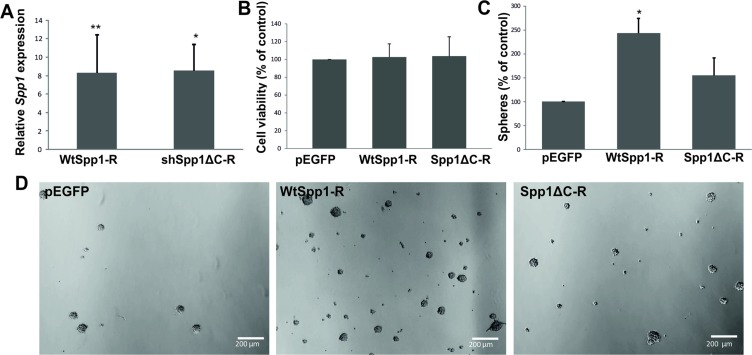
Osteopontin (SPP1, a secreted phosphoprotein 1) is primarily involved in immune responses, tissue remodelling and biomineralization. However, it is also overexpressed in many cancers and regulates tumour progression by increasing migration, invasion and cancer stem cell self-renewal. Mechanisms of SPP1 overexpression in gliomas are poorly understood. We demonstrate overexpression of two out of five SPP1 isoforms in glioblastoma (GBM) and differential isoform expression in glioma cell lines. Up-regulated SPP1 expression is associated with binding of the GLI1 transcription factor to the promoter and OCT4 (octamer-binding transcription factor 4) to the first SPP1 intron of the SPP1 gene in human glioma cells but not in non-transformed astrocytes. GLI1 knockdown reduced SPP1 mRNA and protein levels in glioma cells. GLI1 and OCT4 are known regulators of stem cell pluripotency. GBMs contain rare cells that express stem cell markers and display ability to self-renew. We reveal that SPP1 is overexpressed in glioma initiating cells defined by high rhodamine 123 efflux, sphere forming capacity and stemness marker expression. Forced differentiation of human glioma spheres reduced SPP1 expression. Knockdown of SPP1, GLI1 or CD44 with siRNAs diminished sphere formation. C6 glioma cells stably depleted of Spp1 displayed reduced sphere forming capacity and downregulated stemness marker expression. Overexpression of the wild type Spp1, but not Spp1 lacking a Cd44 binding domain, rescued cell ability to form spheres. Our findings show re-activation of the embryonic-type transcriptional regulation of SPP1 in malignant gliomas and point to the importance of SPP1-CD44 interactions in self-renewal and pluripotency glioma initiating cells.

Keywords: glioma initiating cells; osteopontin; self-renewal; stemness factors; transcription factors.


Conflict of interest statement

CONFLICTS OF INTEREST

None.

Figures

Figure 1
Figure 1. The expression pattern of SPP1 splicing variants in glioma clinical samples and human glioma cell lines
(A) SPP1–e and SPP1-d isoform mRNAs are up-regulated in GBM. The expression level of five SPP1 isoforms was assessed in 36 glioblastoma (GBM), 20 pilocytic astrocytoma (PA) and 5 normal brains (NB) using qPCR. Data were normalized to the expression of GAPDH mRNA determined in the same sample. T-test analysis was performed on -ddCt results, P values were considered significant when *P ≤ 0.05 and **P ≤ 0.01. (B) Prognostic value of the SPP1 expression in GBMs (WHO grade IV) in the TCGA cohort. Kaplan-Meier plots were estimated according to different SPP1 gene expression and overall survival of all GBM patients (n = 359). A chi-square test was used to evaluate differences in survival of patients with SPP1 expression lower or higher than median. (C) Relative expression of SPP1 splicing variants in human glioma cell lines versus non-transformed astrocytes. Human T98G, LN18, LN229, U87 MG, GBM patient derived WG4 glioma cells, and normal human astrocytes (NHA, Lonza) were used. Data were normalized to the expression of GAPDH mRNA and represent mean ± s.d., of three independent passages. T-test analysis was performed on -ddCt results, P values were considered significant when *P ≤ 0.05, **P ≤ 0.01 and *** for P ≤ 0.001. (D) A scheme shows the organisation of the SPP1 gene in different isoforms and location of the most important functional domains.
Figure 2
Figure 2. GLI1 and OCT4 participate in transcriptional regulation of SPP1 expression in glioma cells
(A) The GLI1 binding sequence logo was generated by MathInspector and the results of computational analysis of the human SPP1 gene promoter revealed the presence of two potential GLI1 binding sites. Coloured bands represent positions of the regulatory sites (open chromatin, histone modifications) and the putative GLI1 binding sites with their chromosomal locations identified by MathInspector and the Ensembl funcgen database as described [27]; an arrowhead shows direction of transcription. (B) Binding of GLI1 to the SPP1 gene promoter was detected by chromatin immunoprecipitation (ChIP) in three human glioma cell lines, but not in non-transformed human astrocytes (NHA); an input represents a positive control; IgG is a neutral antibody. (C) Knockdown of GLI1 expression in U87MG glioma cells after siRNA transfection. Human GLI1 was knocked-down using ON-Target PlusSMARTpool Human GLI1 (Dharmacon) with ON-TARGETplus Non-targeting Pool as a control. The results are expressed as mean ± s.d.; P values ≤ 0.05 were considered significant; n = 3. (D, E) Knockdown of GLI1 expression in U87MG glioma cells decreased the SPP1 mRNA level and reduced the level of secreted osteopontin. The results are expressed as mean ± s.d.; P values ≤ 0.05 were considered significant, n = 4. (F) The OCT4 transcription factor binds to the first intron of the SPP1 gene in three glioma cell lines but not in NHA (IgG is a neutral antibody). Primers for the potential OCT4 binding site in the first intron of the SPP1 gene corresponded to the Oct4 binding site in the murine spp1 gene previously described [28]. ChIP with anti-Pol II antibody and binding to the GAPDH gene promoter was performed as a positive control of ChIP reaction in NHA. The PCR products were resolved in 1% agarose gel with ethidium bromide and visualized with UV light. (G) The expression of GLI1 and OCT4 was assessed in 36 glioblastoma (GBM), 20 pilocytic astrocytoma (PA) and 5 normal brains (NB) using qPCR. Data were normalized to the expression of GAPDH mRNA determined in the same sample. T-test analysis was performed on -ddCt results, P values were considered significant when *P ≤ 0.05.
Figure 3
Figure 3. SPP1 expression is up-regulated in glioma initiating cells
(A) Representative examples of dot plots and histograms of Rhod 123(–) subpopulations from 5 glioma cell lines were acquired by flow cytometry. Glioma cells (1 × 10⁷) were trypsinized and incubated with 0.1 μg/ml Rhod123 for 20 min in 37°C. After washing the cells were placed in 37°C for 90 min for Rhod123 exclusion in a dark compartment. Cells kept on ice to inhibit exclusion of Rhod123 were used as a positive control for gating in flow cytometry. Fractions of Rhod123(+) and Rhod123(–) cells were sorted using FACS Aria and a left panel shows a gating strategy. (B) Analysis of SPP1, OCT3/4 and NANOG gene expression in Rhod 123(–) subpopulations sorted from four human glioma cell lines. Total RNA was isolated from sorted cells using Qiagen RNeasy kit and the levels of SPP1, NANOG and OCT3/4 mRNA were determined by qPCR in Rhod 123(+) and Rhod 123(–) subpopulations; their expression in Rhod 123(+) subpopulations was taken as 1 (a red line). P values were calculated with a t-test and considered significant when *P ≤ 0.05 and **P ≤ 0.01. (C) Quantification of the expression of Spp1, Oct3/4 and Nanog in Rhod 123(–) subpopulations isolated from rat C6 glioma cells versus their levels in Rhod 123(+) subpopulations taken as 1 (a red line); n = 3.
Figure 4
Figure 4. SPP1 expression is up-regulated in glioma spheres and reduced after forced differentiation
(A) Human LN18 glioma spheres express the higher levels of SPP1, OCT3/4 and NANOG than adherent cells. For sphere forming assay, cells were seeded at a low density (4000 cells/ml) onto non-adherent plates and cultured in DMEM/F-12 medium, supplemented with B27, 20 ng/ml bFGF, 20 ng/ml EGF and antibiotics; inset shows a representative sphere, 40× magnification. After 14 days resulting spheres and adherent cultures were collected by centrifugation and lysed in Qiagen RLT lysis buffer. Gene expression was determined with qPCR; data are presented as means ± s.d. T-test analysis was performed, P values were considered significant when *P ≤ 0.05 and **P ≤ 0.01; n = 3. (B) Western blot analysis of stemness factors NANOG, OCT4A, SOX2 in adherent (ctrl) and LN18 spheres grown for 14 days. The expression of stemness markers at the protein level was additionally evaluated in human embryonic teratoma Ntera2 cells expressing those stemness markers at very high levels. Samples were run on the same blots to determine the correct band size of proteins. (C) Spheres cultured for 8 days were differentiated for 5 days in the presence of 100 ng/ml BMP4 or 2% FBS. Light microscopy shows morphological alterations of LN18 sphere cultures, in particular spreading of cells and attachment to the bottom of plates when spheres were cultured in the medium containing 2% FBS. (D) Representative images of cells stained for TUB-β III (a neuronal marker) and co-stained with DAPI to visualize cell nuclei. (E) Addition of BMP4 and 2% serum resulted in reduction of the expression of SPP1 in LN18 cells. Spheres cultured for 8 days were differentiated for 5 days in the presence of 100 ng/ml BMP4 or 2% FBS. BMP4 treatment reduced significantly NANOG expression, while serum addition resulted in the reduction of OCT3/4 mRNA level. Data are means ± s.d., n = 5.
Figure 5
Figure 5. Efficient knockdown of SPP1 expression in glioma cells reduces sphere formation
(AB) Knockdown of SPP1 expression in LN18 cells reduced formation of spheres. Human adherent LN18 glioma cells were transfected with siRNAs ON-Target PlusSMARTpool Human SPP1 or ON-TARGETplus Non-targeting Pool (Dharmacon) using 4D-nucleofector AMAXA. After 24 h cells were seeded at a low density (4000 cells/ml) onto non-adherent plates and cultured in a defined medium. Resulting spheres (100–200 μm in size) were counted 7 days after transfection (B). In parallel, the expression of SPP1 in parental cultures was determined by qPCR 48 h after transfection (A) to evaluate efficacy of gene silencing, n = 3. (CD) Knockdown of GLI1 or CD44 expression in LN18 cells impaired sphere formation. LN18 glioma cells were transfected with ON-Target PlusSMARTpool Human GLI1 or CD44 or ON-TARGETplus Non-targeting Pool (Dharmacon) siRNAs using 4D-nucleofector AMAXA. The expression of GLI1 and CD44 in parental cultures was determined by qPCR 48 h after transfection; data are means ± s.d., n = 3 (C). After transfection cells were seeded at a low density onto plates dedicated for a cell suspension culture and cultured 7 days in a defined medium. The resulting spheres (100–200 μm in size) were counted (D). The results are expressed as mean ± s.d.; P values were considered significant when *P ≤ 0.05 and **P ≤ 0.01, n = 3.
Figure 6
Figure 6. Stable knockdown of Spp1 expression in C6 glioma cells reduces sphere formation and stemness factor expression
(AB) Efficient stable knockdown of Spp1 expression in rat C6 glioma cells was confirmed by qPCR and ELISA. Control shNeg cells expressed Spp1 and SPP1/osteopontin at the similar level as parental C6 cells (WT). (C) Stable knockdown of Spp1 expression in C6 glioma cells inhibited formation of spheres. Cells were seeded at a low density (4000 cells/ml) onto non-adherent plates and cultured in DMEM/F-12 medium, supplemented with B27, 20 ng/ml bFGF, 20 ng/ml EGF and antibiotics. Representative images show the reduced formation of spheres (100–200 μm in size) derived from the shSpp1 glioma cells 14 days after seeding. (D) Quantification of resulting spheres derived from shNeg and shSpp1 glioma cells was performed 14 days after seeding; data are means ± s.d., n = 3. (E) Reduced expression of Nanog and Oct3/4 in spheres derived from shSpp1 glioma cells. Spheres were collected by centrifugation 14 days after seeding and the expression of Nanog and Oct3/4 in cultures was determined by qPCR; data are presented as means ± s.d., n = 3.
Figure 7
Figure 7. The CD44 binding domain of Spp1 is critical for sphere formation
(A) C6 glioma cells stably expressing shSpp1 were transfected with various constructs: a control pEGFP, a shRNA resistant, wild type Spp1 (WtSpp1-R) or a shRNA resistant Spp1 lacking a CD44 binding domain (Spp1ΔC-R). Twenty four hours after transfection cells were seeded (8000 cells/ml) under sphere forming conditions (DMEM/F-12 medium with B27, 20 ng/ml bFGF, 20 ng/ml EGF and antibiotics). Reconstitution of Spp1 expression in cells transfected with WtSpp1-R or Spp1ΔC-R was determined by qPCR in respective cultures and related to values obtained for shSpp1 cells. Data are presented as means ± s.d., n = 3. (B) Reconstitution of Spp1expression in cells transfected with a control pEGFP, WtSpp1-R or Spp1ΔC-R had no influence cell viability (as determined by MTT metabolism assay 24 h after transfection). (C) Only reconstitution of Spp1 expression in glioma cells transfected with a WtSpp1-R restored cell capacity to form spheres. Data are presented as means ± s.d., P values were considered significant when *P ≤ 0.05 and **P ≤ 0.01, n = 3. (D) Representative images show the reduced formation of spheres derived from the shSpp1 glioma cells transfected with pEGFP 7 days after seeding. Overexpression of the construct coding for a wild type (WtSpp1-R) restored sphere forming capacity of glioma cells; overexpression of Spp1ΔC-R did not restore sphere forming capacity.

References

    1. Anborgh PH, Mutrie JC, Tuck AB, Chambers AF. Role of the metastasis-promoting protein osteopontin in the tumour microenvironment. J Cell Mol Med. 2010;14:2037–2044. - PMC - PubMed
    1. Brown LF, Papadopoulos-Sergiou A, Berse B, Manseau EJ, Tognazzi K, Perruzzi CA, Dvorak HF, Senger DR. Osteopontin expression and distribution in human carcinomas. Am J Pathol. 1994;145:610–623. - PMC - PubMed
    1. Tuck AB, Chambers AF, Allan AL. Osteopontin overexpression in breast cancer: knowledge gained and possible implications for clinical management. J Cell Biochem. 2007;102:859–868. - PubMed
    1. Rittling SR, Chambers AF. Role of osteopontin in tumour progression. Br J Cancer. 2004;90:1877–1881. - PMC - PubMed
    1. Bellahcène A, Castronovo V, Ogbureke KU, Fisher LW, Fedarko NS. Small integrin–binding ligand N–linked glycoproteins (SIBLINGs): multifunctional proteins in cancer. Nat Rev Cancer. 2008;8:212–226. - PMC - PubMed

MeSH terms