. 2017 Feb 7;8(6):9608-9616.
doi: 10.18632/oncotarget.14155.

The tumor microenvironment promotes cancer progression and cell migration

Affiliations

The tumor microenvironment promotes cancer progression and cell migration

Viviana Salvatore et al. Oncotarget. .

Abstract

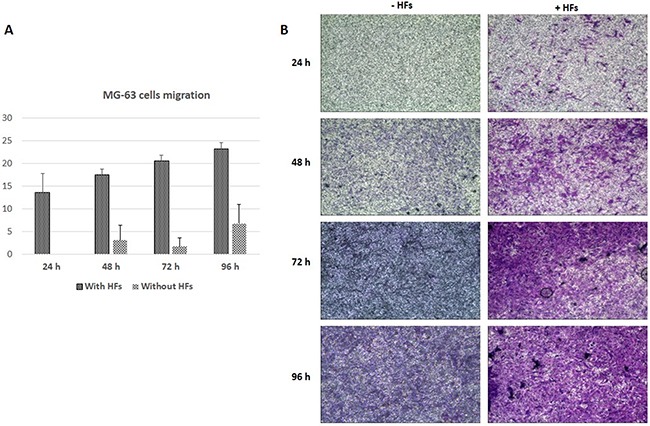
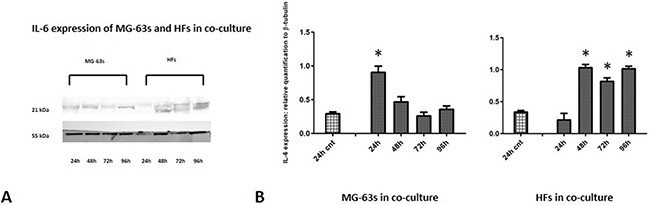
The tumor microenvironment contributes to cancer progression, in part through interactions between tumor and normal stromal cells. This study analyzed morphological and molecular changes induced in co-cultured human fibroblasts (HFs) and the MG-63 osteosarcoma cell line. Co-cultured cell monolayers were morphologically analyzed using high resolution scanning electron microscopy (HR-SEM), and trans-well assays were performed to assess cell migration and invasion. Proteins involved in inflammatory responses, cancer cell invasion, and angiogenesis were assessed using western blotting. HR-SEM showed progressive spatial orientation loss by fibroblasts in contact with MG-63s, while MG-63s proliferated rapidly and invaded HF space. Trans-well assays showed enhanced MG-63 migration in the presence of HFs. IL-6 expression was increased in co-cultured HFs, possibly stimulated by TNF-α. HFs do not normally express YKL-40 but did so in co-culture. Band densitometric analyses showed that increasing YKL-40 expression was followed by VEGF overexpression, especially in MG-63s. Finally, our results confirmed fibroblasts as the main matrix metalloproteinase source in this tumor microenvironment. Our study sheds new light on how tumor-stroma interactions promote tumor development and progression, and may support identification of novel anti-cancer therapeutics.

Keywords: co-culture; human fibroblasts; osteosarcoma; tumor microenvironment; tumor stroma.


Conflict of interest statement

CONFLICTS OF INTEREST

The authors declare no conflicts of interest.

Figures

Figure 1
Figure 1. HR-SEM analyses
HF control at 24 h (Bar: 10 μm) A. Flat and elongated morphology (arrow). MG-63 control at 24 h (Bar: 10 μm) B. Polygonal morphology (star). HFs C. and MG-63s D. after 24 h of co-culture (Bar: 10 μm). HFs E. and MG-63s F. after 48 h of co-culture. Loss of fibroblast orientation (E., arrow); reduced MG-63 proliferation (Bar: 100 μm) and formation of clusters (F., stars). HFs G. and MG-63s H. after 72 h of co-culture (Bar: 100 μm). MG-63 invasion of HF space (H., stars). HFs I. and MG-63s J. after 96 h of co-culture (Bar: 100 μm). Overlap of MG-63s with HFs (I., arrow). Detail of MG-63s at 96 h of co-culture K. Pseudopod protrusions (stars) and pre-uropod region (arrow) (Bar: 10 μm). Detail of MG-63 control at 96 h (Bar: 10 μm) L.
Figure 2
Figure 2. Cell migration assay
MG-63 cell migration (%) A. * represents a difference between MG-63 cells cultured with and without HFs, P<0.05. Giemsa staining of migrating MG-63 cells, with or without HFs B.
Figure 3
Figure 3. Western blot for TNF-α
Densitometric analysis A. TNF-α expression in co-cultured HFs and MG-63 cells B. * represents a difference between co-cultured cells and HF or MG-63 cells alone. P<0.05.
Figure 4
Figure 4. Western blot for IL-6
Densitometric analysis A. IL-6 expression in co-cultured HFs and MG-63 cells B. * represents a difference between co-cultured cells and HF or MG-63 cells alone. P<0.05.
Figure 5
Figure 5. Western blot for YKL-40
Densitometric analysis A. YKL-40 expression in co-cultured HFs and MG-63 cells B. * represents a difference between co-cultured cells and HF or MG-63 cells alone. P<0.05.
Figure 6
Figure 6. Western blot for VEGF
Densitometric analysis A. VEGF expression in co-cultured HFs and MG-63 cells B. * represents a difference between co-cultured cells and HF or MG-63 cells alone. P<0.05.
Figure 7
Figure 7. Western blot for MMP-9
Densitometric analysis A. MMP-9 expression in co-cultured HFs and MG-63 cells B. * represents a difference between co-cultured cells and HF or MG-63 cells alone. P<0.05.

Similar articles

Cited by

References

    1. Clark AG, Vignjevic DM. Modes of cancer cell invasion and the role of the microenvironment. Curr Opin Cell Biol. 2015 doi: 10.1016/j.ceb.2015.06.004. - DOI - PubMed
    1. Friedl P, Alexander S. Cancer invasion and the microenvironment: plasticity and reciprocity. Cell. 2011 doi: 10.1016/j.cell.2011.11.016. - DOI - PubMed
    1. Egeblad M, Rasch MG, Weaver VM. Dynamic interplay between the collagen scaffold and tumor evolution. Curr Opin Cell Biol. 2010 doi: 10.1016/j.ceb.2010.08.015. - DOI - PMC - PubMed
    1. Salvatore V, Focaroli S, Teti G, Falconi M. Changes in the gene expression of co-cultured human fibroblast cells and osteosarcoma cells: the role of microenvironment. Oncotarget. 2015;6:28988–98. doi: 10.18632/oncotarget.4902. - DOI - PMC - PubMed
    1. Mocellin S, Nitti D. TNF and cancer: the two sides of the coin. Front Biosci. 2008:2774–2783. - PubMed

MeSH terms