. 2017 Jan 31;8(5):7276-7293.
doi: 10.18632/oncotarget.14085.

Drug-induced premature senescence model in human dental follicle stem cells

Affiliations

Drug-induced premature senescence model in human dental follicle stem cells

Yuanfen Zhai et al. Oncotarget. .

Abstract

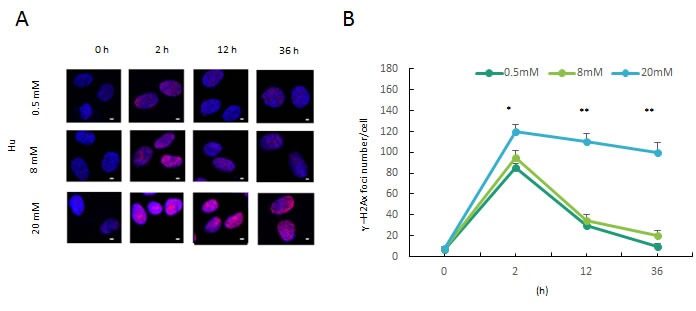
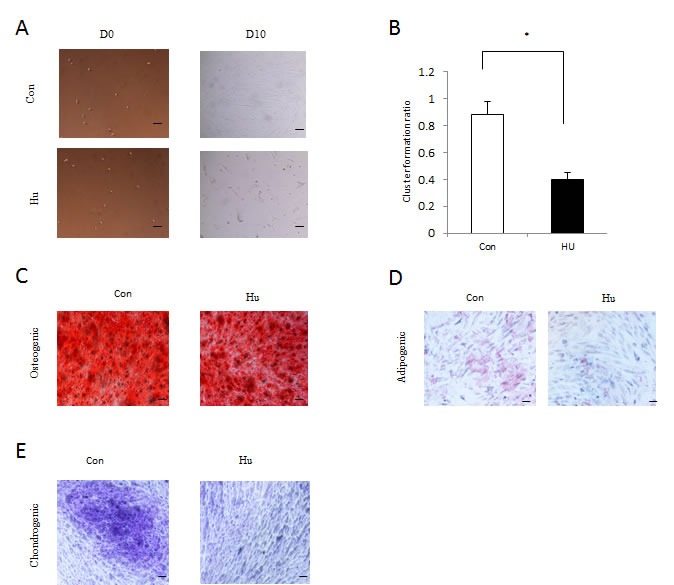
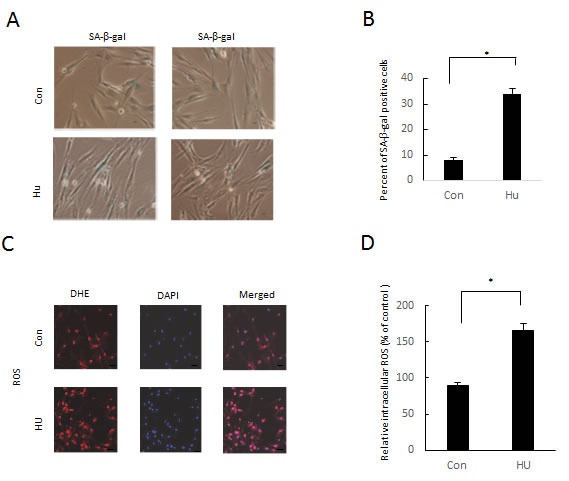
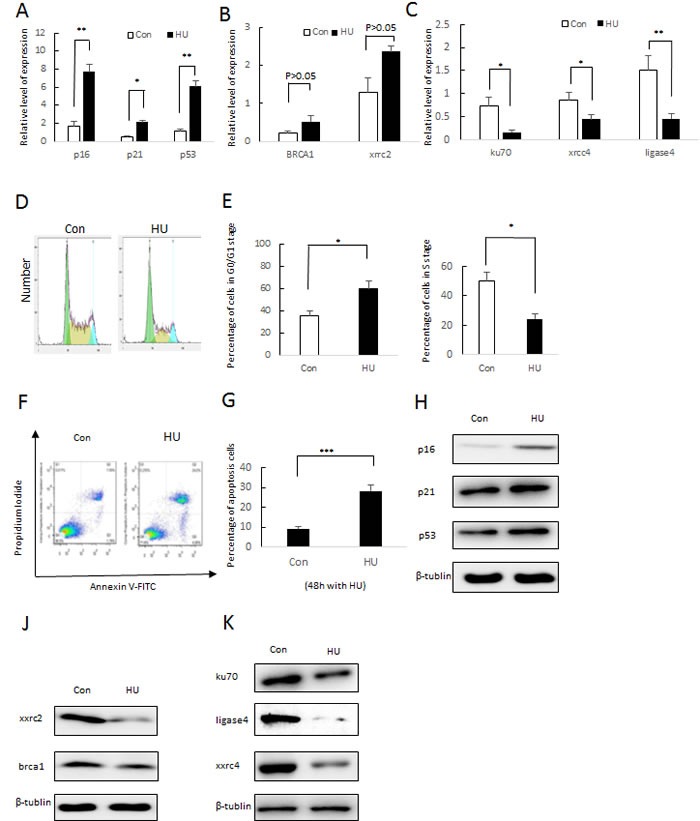
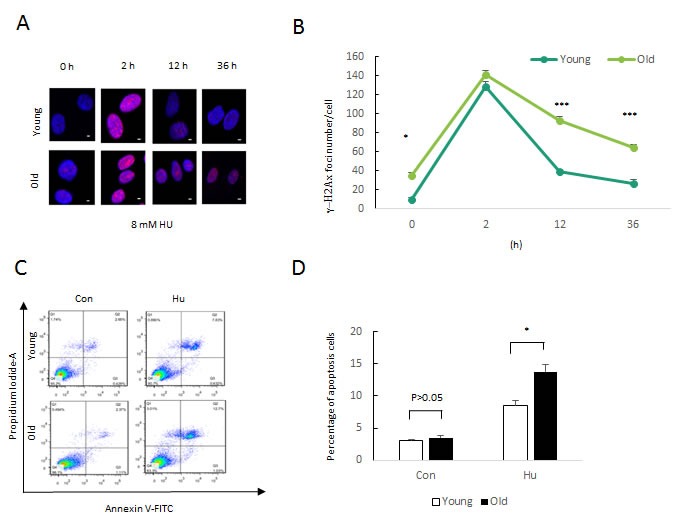
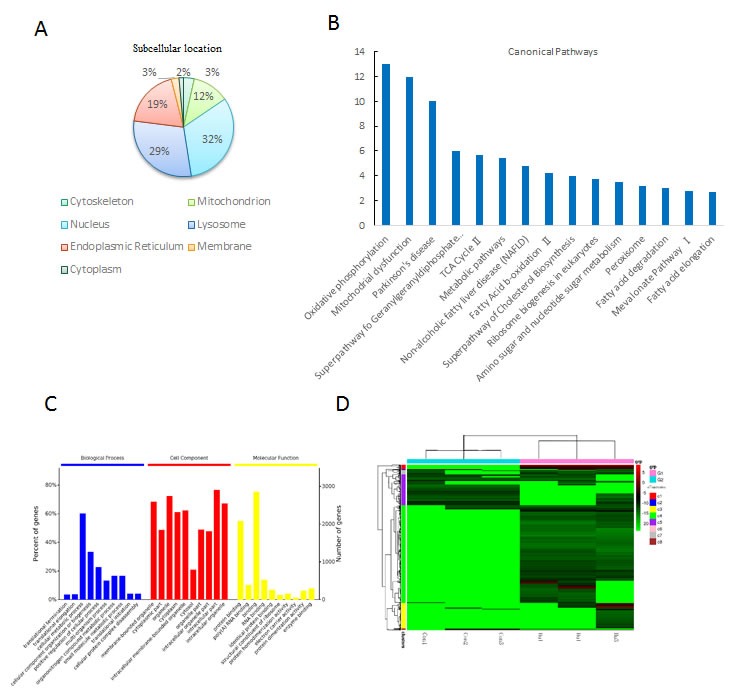
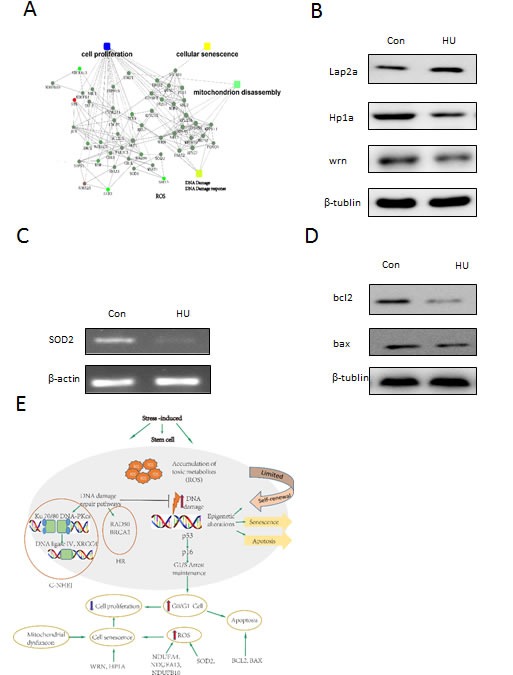
Aging is identified by a progressive decline of physiological integrity leading to age-related degenerative diseases, but its causes is unclear. Human dental pulp stem cells (hDPSCs) has a remarkable rejuvenated capacity that relies on its resident stem cells. However, because of the lack of proper senescence models, exploration of the underlying molecular mechanisms has been hindered. Here, we established a cellular model utilizing a hydroxyurea (HU) treatment protocol and effectively induced Human dental pulp stem cells to undergo cellular senescence. Age-related phenotypic changes were identified by augmented senescence-associated-β-galactosidase (SA-β-gal) staining, declined proliferation and differentiation capacity, elevated G0/G1 cell cycle arrest, increased apoptosis and reactive oxygen species levels. Furthermore, we tested the expression of key genes in various DNA repair pathways including nonhomologous end-joining (NHEJ) and homologous recombination (HR) pathways. In addition, our results showed that Dental pulp stem cells from young donors are more resistant to apoptosis and exhibit increased non-homologous end joining activity compared to old donors. Further transcriptome analysis demonstrate that multiple pathways are involved in the HU-induced Dental pulp stem cells ageing, including genes associated with DNA damage and repair, mitochondrial dysfunction and increased reactive oxygen species levels. Taken together, the cellular model have important implications for understanding the molecular exploration of Dental pulp stem cells senescence and aging.

Keywords: DNA damage; Gerotarget; aging; cellular senescence model; dental stem cells; stress.


Conflict of interest statement

CONFLICTS OF INTEREST

The authors declare no conflict of interest.

Figures

Figure 1
Figure 1. Persistent DNA damage induced by HU treatment
a. Formation of DNA double-strand breaks in DFSCs post HU treatment. DFSCs were treated with 0.5, 8 and 20mM HU for for 2 or 12 h and and allowed to recover until 36 h post treatment. Cells were fixed and stained for γH2AX foci (red) at the indicated time points post HU treatment. Scale bar: 5 mm. b. Graphical depiction of the number of γH2AX foci in DFSCs treated with 0.5, 8 and 20mM HU over 36 h. Data are expressed as mean±S.E. from three independent experiments. *P < 0.05, **P < 0.01, two-way ANOVA with Fisher's post hoc test
Figure 2
Figure 2. Proliferation and differentiation of HU-treated DFSCs
a. In vitro proliferative capacity of DFSCs assayed by colony formation experiment. Representative images of colony from control (Con) and HU-treated (HU) cells. The number of colony formed after 10 days was counted. D0 shows the plated DFSCs after single-cell dissociation at day 0. D10 shows the colony formed after 10 days of culturing. Scale bar: 50 mm. b. In vitro proliferative capacity of DFSCs assayed by colony formation experiment. The number of DFSCs formed after 10 days was counted. Statistics for the ratio of DFSCs formation after 10 days in vitro. Mean±S.E. from three independent experiments. *P < 0.05, Student's t-test. c. After Osteogenic differentiation, DFSCs with and without HU treatment were analyzed by Alizarin Red staining after 3 weeks of culture (scale bar 50 μm). d. At day 14 after induction of differentiation, DFSCs with and without HU treatment was stained with Oil Red O (scale bar 50 μm). e. After Chondrogenic differentiation, DFSCs with and without HU treatment were stained with Alcian blue in combination with PAS (Periodic acid-Schiff) in an automated slide stainer and photo-documented (scale bar 50 μm).
Figure 3
Figure 3. Phenotypic characterization of 8 mM HU-treated DFSCs
a. Images of SA-β-gal+ DFSCs. with or without HU treatment. b. Statistics of the percentage of SA-β-gal+ DFSCs, mean±S.E. *P < 0.05, Student's t-test, Scale bar: 50 mm. c. ROS were detected using dihydroethidium (DHE) fluorescence. d. ROS level was normalized to that of control cells with statistics expressed as mean±S.E. *P < 0.05, Student's t-test. Scale bar: 60 mm.
Figure 4
Figure 4. Molecular characterization of 8 mM HU-treated DFSCs
a. qRT-PCR analysis of p16, p21 and p53 expression normalized by β-actin. Values represent mean±S.E. of two independent samples conducted in triplicate. *P < 0.05; **P < 0.01, Student's t-test. b. qRT-PCR analysis of HR (X-ray repair cross complementing 2 (xrcc2) and brca1) and NHEJ (ku70, ligase4 and X-ray repair cross complementing 4 (xrcc4)) gene expression normalized by β-actin c. Values represent mean±S.E. of two independent samples conducted in triplicate. *P < 0.05; **P < 0.01, Student's t-test. d. Cell cycle arrest of DFSC cells was were treated with 8 mM HU and without HU (Con). After 24 h of incubation, cells were harvested and stained with PI followed by Cellometer imaging and analysis. X-axis indicated the PI fluorescence intensity that correlates to the DNA content. e. FACS analysis and percentages of different cell stages are presented as mean of percentage±S.E. . f. DFSC cells were treated with HU (8 mM) and without HU for 48 h and examined by flow cytometry using Annexin-V/PI staining to label apoptotic cells. g. FACS analysis and percentages of apoptotic cells are presented as mean of percentage±S.E. .(f) Western blotting analysis of p16 and p21 expression. (g) Western blotting analysis of xxrc2 and brac1 expression. (j) Western blotting analysis of ku70, ligade4 and xxrc4 expression
Figure 5
Figure 5. Phenotypic and molecular characterization of 8mM HU-treated DFSCs between Young and Old
a. Formation of DNA double-strand breaks in DFSCs post HU treatment. DFSCs were treated with 0.5, 8 and 20mM HU for for 2 or 12 h and and allowed to recover until 36 h post treatment. Cells were fixed and stained for γH2AX foci (red) at the indicated time points post HU treatment. Scale bar: 5 mm. b. Graphical depiction of the number of γH2AX foci in DFSCs treated with 0.5, 8 and 20mM HU over 36 h. Data are expressed as mean±S.E. from three independent experiments. *P < 0.05, **P < 0.01, two-way ANOVA with Fisher's post hoc test. c. DFSC cells were treated with 8 mM HU for 48 h and examined by flow cytometry using Annexin-V/PI staining to label apoptotic cells. d. FACS analysis and percentages of apoptotic cells are presented as mean of percentage±S.E. .
Figure 6
Figure 6. Biological function analysis of the differentially expressed proteins post HU treatment
a. The cellular component annotations of differentially expressed proteins with GO analysis from DAVID database. b. Top canonical pathways altered post HU treatment with mitochondrial dysfunction being the most significant one. c. GO annotation of identified age-related proteins in three categories: biological process (BP), cellular component (CC) and molecular function (MF). d. Heat map visualization of significantly regulated probe sets. A hierarchical clustering was analyzed on the probe sets and gene transcripts were selected from 6 chips in 2 arrays (Con and HU treatment) through a filter criteria of at least 2-fold changes with P≤0.05 (F test). Columns: samples; rows: genes; color key indicates gene expression value, green: lowest, red: highest.
Figure 7
Figure 7. Candidate genes and pathways identified through the DFSC cellular aging model associated with aging characteristics
a. The key regulatory networks underlying the HU-induced aging model. Proteomic data were imported into the IPA and interacting pathways were constructed in protein expression. b. Western blotting analysis of lap2a, hp1a and wrn expression. c. Verification of SOD2 expression by RT-PCR with β-actin as an internal control. The data are presented as mean±S.E. from three independent experiments. d. Western blotting analysis of bal2 and bax expression. e. The schematic diagram outlines the key players and pathways that may mechanistically contribute to the phenotypes in our DFSC aging model.

Similar articles

Cited by

References

    1. Kirkwood TB. Understanding the odd science of aging. Cell. 2005;120(4):437–447. - PubMed
    1. López-Otín C, Blasco MA, Partridge L, Serrano M, Kroemer G. The hallmarks of aging. Cell. 2013;153(6):1194–1217. - PMC - PubMed
    1. Mohrin M, Shin J, Liu Y, Brown K, Luo H, Xi Y, Haynes CM, Chen D. Stem cell aging. A mitochondrial UPR-mediated metabolic checkpoint regulates hematopoietic stem cell aging. Science. 2015;347(6228):1374–1377. - PMC - PubMed
    1. Lopez-Otin C, Blasco MA, Partridge L, Serrano M, Kroemer G. The hallmarks of aging. Cell. 2013;153(6):1194–1217. - PMC - PubMed
    1. Vijg J, Campisi J. Puzzles, promises and a cure for ageing. Nature. 2008;454(7208):1065–1071. - PMC - PubMed

MeSH terms