Review
. 2017 Jan;19(1):11-27.
doi: 10.5853/jos.2016.00563. Epub 2016 Dec 12.

Imaging of Intracranial Hemorrhage

Affiliations
Review

Imaging of Intracranial Hemorrhage

Jeremy J Heit et al. J Stroke. 2017 Jan.

Abstract

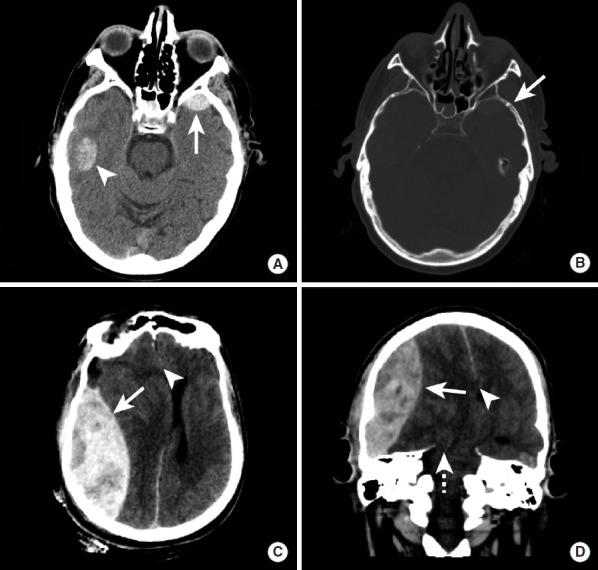
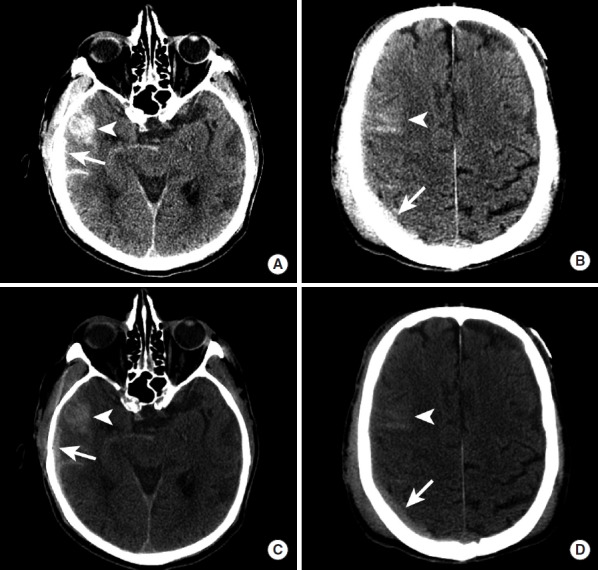
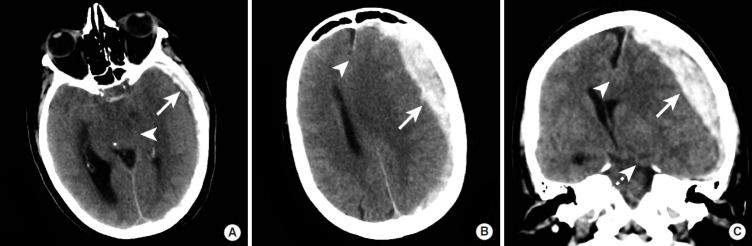
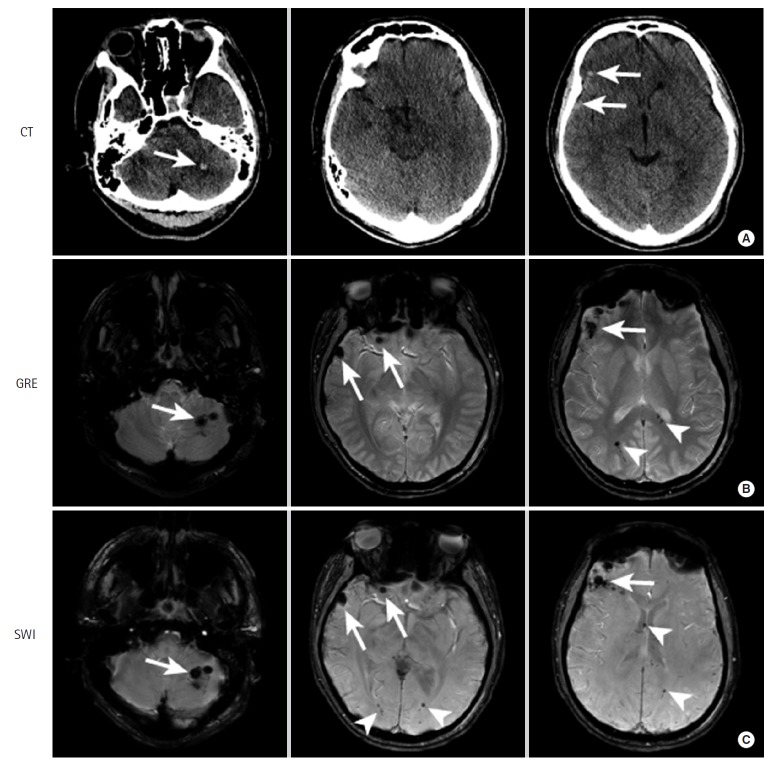
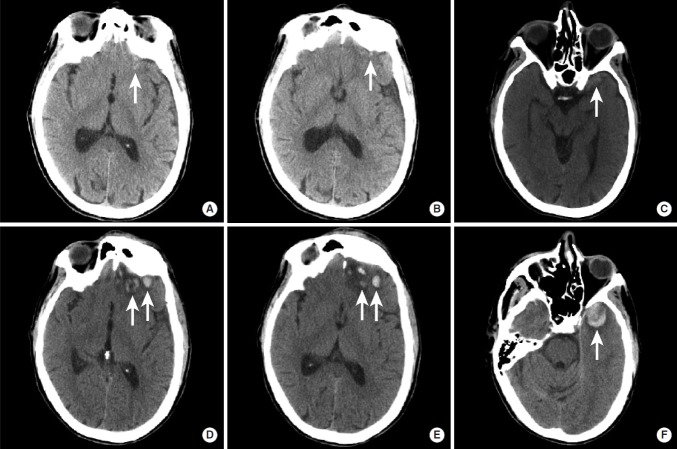
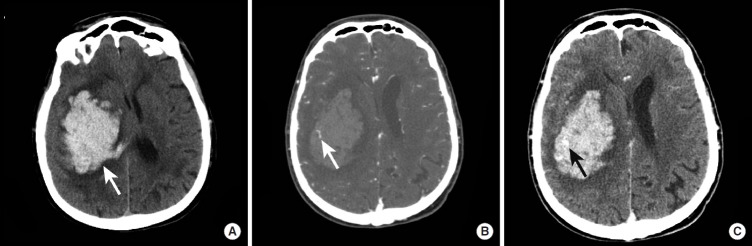
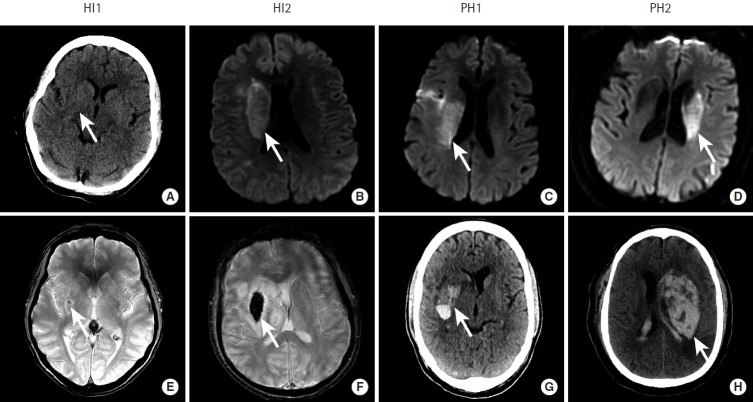
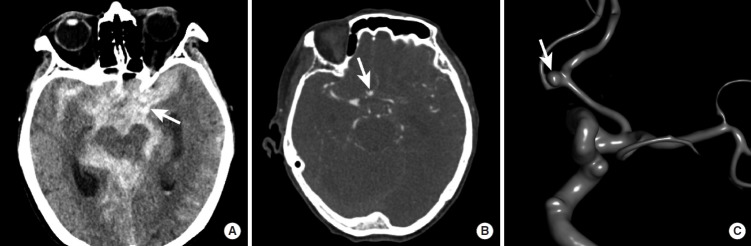
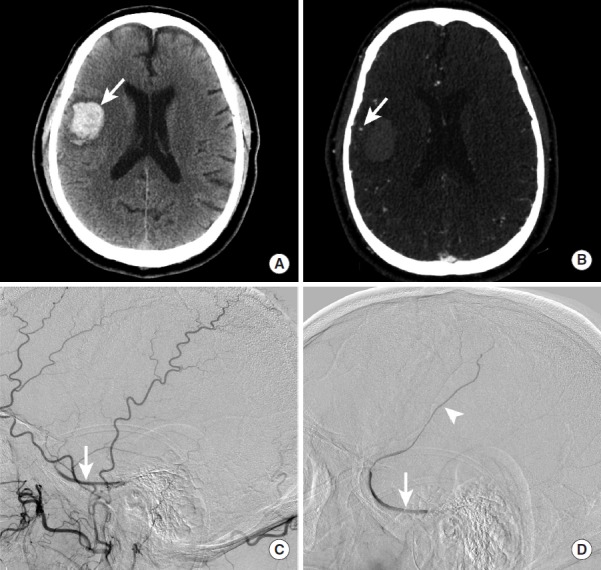
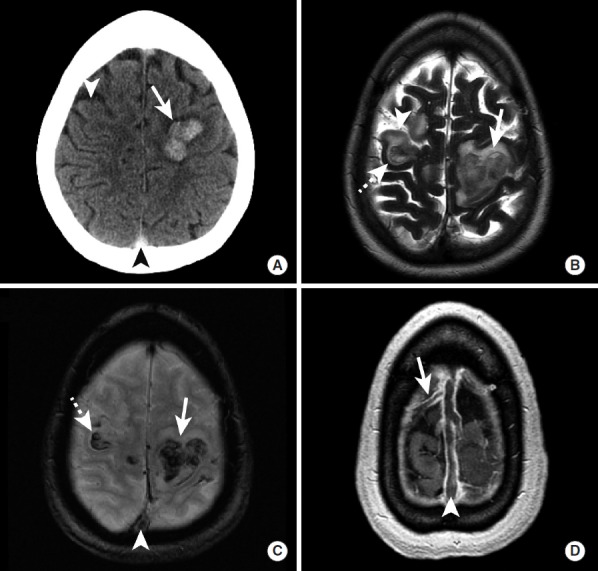
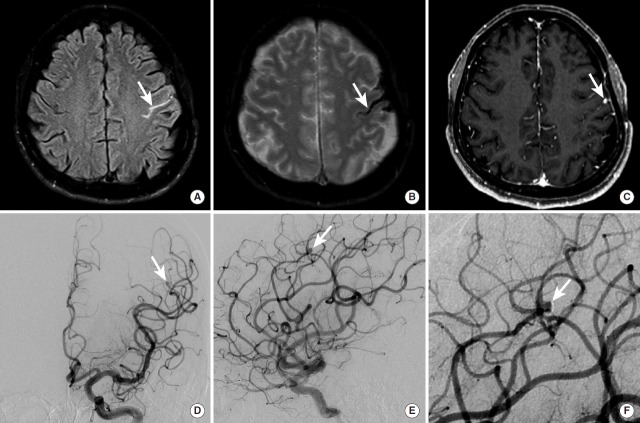
Intracranial hemorrhage is common and is caused by diverse pathology, including trauma, hypertension, cerebral amyloid angiopathy, hemorrhagic conversion of ischemic infarction, cerebral aneurysms, cerebral arteriovenous malformations, dural arteriovenous fistula, vasculitis, and venous sinus thrombosis, among other causes. Neuroimaging is essential for the treating physician to identify the cause of hemorrhage and to understand the location and severity of hemorrhage, the risk of impending cerebral injury, and to guide often emergent patient treatment. We review CT and MRI evaluation of intracranial hemorrhage with the goal of providing a broad overview of the diverse causes and varied appearances of intracranial hemorrhage.

Keywords: Epidural hematoma; Head trauma; Intracranial hemorrhage; Intraparenchymal hemorrhage; Subarachnoid hemorrhage; Subdural hematoma.


Conflict of interest statement

The authors have no financial conflicts of interest.

Figures

Figure 1.
Figure 1.
Traumatic SAH following a motor vehicle crash. (A) NCCT demonstrates hyperdense SAH (arrow) within the cerebral sulci near the convexity. A subdural hematoma overlying the left cerebral hemisphere (arrowhead) and a subgaleal hematoma overlying the right parietal bone (dashed arrow) are also present. (B) FLAIR MRI sequence demonstrates SAH as hyperintense signal within the cerebral sulci (arrow) and the left subdural hematoma as hyperintense signal overlying the left parietal lobe (arrowhead). The subgaleal hematoma overlying the right parietal bone is again seen (dashed arrow). (C) GRE MRI demonstrates SAH as hypointense signal within the cerebral sulci (arrow) and the left subdural hematoma as hypointense signal overlying the left parietal lobe (arrowhead). The subgaleal hematoma overlying the right parietal bone is also present (dashed arrow). SAH, subarachnoid hemorrhage; NCCT, non-contrast CT; FLAIR, Fluid Attenuated Inversion Recovery; MRI, magnetic resonance imaging; GRE, gradient-echo; CT, computed tomography.
Figure 2.
Figure 2.
Traumatic intracranial hemorrhage in two patients. NCCT was performed in a patient with decreased mental status following a bicycle crash (A, B). A hemorrhagic parenchymal contusion is present in the right temporal lobe (A, arrowhead), and a crescentic epidural hematoma is present anterior to the left anterior temporal lobe (A, arrow). A non-displaced temporal bone fracture is present adjacent to the epidural hematoma (B, arrow). A second patient with obtundation after a motor vehicle crash underwent a NCCT (C, D). A large biconvex epidural hematoma (C, D, arrows) exerts significant mass effect on the right cerebral hemisphere and results in leftward midline shift and subfalcine herniation (C, D, arrowhead) and right uncal herniation (D, dashed arrow). NCCT, non-contrast CT.
Figure 3.
Figure 3.
CT window and level adjustment to visualize subdural hematomas. A patient with traumatic ICH underwent a NCCT. Standard brain window of 75 and level of 20 (A, B) and an optimal subdural window of 150 and level of 30 (C, D) are shown. A hemorrhagic contusion in the right anterior temporal lobe (A, C, arrowhead) and sulcal SAH overlying the right frontal lobe (B, D, arrowhead) are well seen using both window/level combinations. A right hemispheric subdural hematoma (A-D, arrows) is less well seen on standard brain windows (A, B) when compared to the subdural window/level (C, D). CT, computed tomography; ICH, intracranial hemorrhage; NCCT, non-contrast CT; SAH, subarachnoid hemorrhage.
Figure 4.
Figure 4.
Brain herniation due to a large subdural hematoma. NCCT images in a patient with a large left hemispheric subdural hematoma. The subdural hematoma (A-C, arrows) results in effacement of the basal cisterns (A, arrowhead), subfalcine herniation (B, C, arrowheads), and left uncal herniation (C, dashed arrow). NCCT, non-contrast CT.
Figure 5.
Figure 5.
Hemorrhagic parenchymal contusions detected by CT and MRI. A patient with traumatic ICH was underwent evaluation by NCCT (A) and MRI that included GRE (B) and SWI (C) sequences. The conspicuity of hemorrhagic contusions (arrows) is increased on both GRE and SWI MRI sequences compared to CT. Cerebral microhemorrhages are present in the cerebral white matter on both GRE and SWI sequences (arrowheads). CT, computed tomography; MRI, magnetic resonance imaging; ICH, intracranial hemorrhage; NCCT, non-contrast CT; GRE, gradient-echo; SWI, susceptibility-weighted imaging.
Figure 6.
Figure 6.
Interval growth of hemorrhagic parenchymal contusions. NCCT images in a patient with traumatic brain injury were obtained at the time of presentation to the hospital (A-C) and two hours later (D-F). Multiple small hemorrhagic contusions are present in the left orbital frontal gyrus (A, B, D, E, arrows) and in the left anterior temporal lobe (C, F, arrows). All of these contusions demonstrate significant interval growth on follow-up imaging (D-F). NCCT, non-contrast CT.
Figure 7.
Figure 7.
Spot sign in a hypertensive patient with a large intraparenchymal hemorrhage. NCCT images demonstrate a large hyperdense hemorrhage centered in the right basal ganglia (A, arrow). CTA images obtained in the arterial phase demonstrate a rounded area of contrast extravasation within the hematoma (“spot sign”) that is separate from any adjacent blood vessel (B, arrow). Delayed phase CTA image shows pooling of contrast in the same region (D, arrow) that represents active hemorrhage. NCCT, non-contrast CT; CTA, CT Angiography.
Figure 8.
Figure 8.
Lobar hemorrhage due to cerebral amyloid angiopathy. NCCT (A), MRI GRE (B), and MRI SWI images (C) demonstrate intraparenchymal hemorrhage in the right temporal and occipital lobes (A, B, C, arrows). The pattern of hemorrhage is lobar and does not confine to an arterial vascular territory. The patient was eventually diagnosed with CAA. NCCT, non-contrast CT; MRI, magnetic resonance imaging; GRE, gradient-echo; SWI, susceptibility-weighted imaging; CAA, cerebral amyloid angiopathy.
Figure 9.
Figure 9.
Spectrum of MR imaging findings in patients with cerebral amyloid angiopathy. MRI, including FLAIR (A, C) and GRE (B, D) sequences, was obtained in two patients with CAA. Patient 1 (A, B) demonstrates diffuse hyperintense signal abnormality throughout the cerebral white matter on FLAIR imaging (A, arrow) that corresponds to microangiopathic changes secondary to amyloid-ß peptide deposition in the arterial walls. In addition, evidence of prior microhemorrhage (B, arrowheads) and cortical (B, arrow) hemorrhage is demonstrated as hypointense signal abnormality. Patient 2 (C, D) demonstrates less prominent hyperintense signal abnormality in the perventricular cerebral white matter on FLAIR imaging (C, arrow), but multiple foci of prior microhemorrhage are present (D, arrowheads). MRI, magnetic resonance imaging; FLAIR, Fluid Attenuated Inversion Recovery; GRE, gradient-echo; CAA, cerebral amyloid angiopathy.
Figure 10.
Figure 10.
Hemorrhagic conversion of ischemic stroke after endovascular revascularization. Acute ischemic infarction in the middle cerebral artery territory in four patients (columns) is identified as hypoattenuation within the right lentiform nucleus (A, arrow), restricted diffusion within the right caudate body (B, C, arrows), and restricted diffusion in the left caudate body (D, arrow). All four patients were successfully treated by endovascular therapy, but all developed hemorrhagic conversion of their infarctions on follow up GRE MRI. HI1 hemorrhage is shown as a punctate focus of susceptibility blooming in the right lentiform nucleus (E, arrow). HI2 hemorrhage is shown as confluent susceptibility blooming within the right lentiform nucleus (F, arrow). PH1 hemorrhage is present as hyperdensity with a fluid level within the right lentiform nucleus. PH2 hemorrhage is present as a large region of hyperdensity centered in the left basal ganglia with significant associated mass effect on the adjacent brain and left lateral ventricle.
Figure 11.
Figure 11.
Hemorrhagic conversion of a left posterior inferior cerebellar artery territory infarction that required posterior fossa decompression surgery. Diffusion-weighted MRI demonstrates an acute stroke within the left posterior inferior cerebellar artery territory at the time of presentation (A). Three days later, the patient developed HI2 hemorrhage within the area of infarction (B, arrow) and swelling of the infarcted tissue that completely effaced the fourth ventricle (B, arrowhead). A suboccipital craniectomy (C, arrow) was performed with subsequent decompression of the fourth ventricle (C, arrowhead).
Figure 12.
Figure 12.
Diffuse subarachnoid hemorrhage following rupture of an anterior communicating artery aneurysm. NCCT shows diffuse SAH as hyperdensity within the basal cisterns (A, arrow). A CTA revealed a saccular aneurysm arising from the anterior communicating artery complex (B, arrow). A 3-dimensional angiogram during diagnostic cerebral angiography further characterizes this saccular aneurysm (C, arrow). NCCT, non-contrast CT; SAH, subarachnoid hemorrhage; CTA, CT Angiography.
Figure 13.
Figure 13.
Intraparenchymal hemorrhage due to rupture of a small cerebral arteriovenous malformation in a pediatric patient. NCCT demonstrates a hyperdense intraparenchymal hemorrhage within the right frontal lobe (A, arrow), and maximum intensity projection images from a CTA demonstrate a tangle of vessels along the anterior margin of this hemorrhage (B, arrow). A cerebral DSA identified a small arteriovenous malformation (C, arrow) with a subtle early draining cortical vein (C, arrowhead). NCCT, non-contrast CT; CTA, CT Angiography; DSA, digital subtraction angiography.
Figure 14.
Figure 14.
Intraparenchymal hemorrhage secondary to rupture of a dural arteriovenous fistula. NCCT shows a hyperdense intraparenchymal hemorrhage (A, arrow) within the inferior right temporal lobe. A CTA shows a prominent cortical vein overlying the region of hemorrhage (B, arrow). DSA (C, D) demonstrates contrast opacification of the right sphenoparietal sinus during the arterial phase (C, arrow) following injection of the right external carotid artery. More delayed DSA images demonstrate further retrograde filling of the right sphenoparietal sinus (D, arrow) and a cortical vein that courses superiorly (D, arrowhead); this cortical vein corresponds to the prominent vein identified on the CTA (B, arrow). NCCT, non-contrast CT; CTA, CT Angiography; DSA, digital subtraction angiography.
Figure 15.
Figure 15.
Intraparenchymal hemorrhage secondary to superior sagittal sinus thrombosis in a hypercoagulable female patient. NCCT (A) demonstrates hyperdense intraparenchymal hemorrhage in the posterior left superior and middle frontal gyri (A, arrow) and hypodense ischemic injury to the right middle frontal gyrus (A, arrowhead). MRI (B-D) further demonstrates intraparenchymal hemorrhage in the left superior and middle frontal gyri as heterogeneous T2 hypointense hemorrhage (B, arrow) and GRE hypointense signal (B, arrowhead) with surrounding T2 hyperintense edema. There is also intraparenchymal hemorrhage in the right middle frontal gyrus (B, dashed arrow) located posterior to a small area of ischemic infarction (B, arrowhead) that was identified on the prior head CT (A, arrowhead). GRE hypointense signal (C, arrowhead) and a filling defect on post-contrast volumetric MRI (D, arrowhead) identifies a filling defect in the superior sagittal sinus thrombosis that is the cause of this intracranial hemorrhage and ischemic injury. Additional thrombus is noted extending into an anterior right cortical vein on post-contrast volumetric imaging (D, arrow). NCCT, non-contrast CT; MRI, magnetic resonance imaging; GRE, gradient-echo.
Figure 16.
Figure 16.
Sulcal subarachnoid hemorrhage secondary to cerebral arterial vasculitis. A middle-aged female patient presented with a headache. MRI FLAIR imaging demonstrates abnormal hyperintense signal within the right marginal sulcus (A, arrow), and MRI GRE imaging demonstrates abnormal hypointense signal within the right marginal sulcus more inferiorly (B, arrow). A cerebral DSA (C, D) demonstrates subtle beading within the M4 segments of the right middle cerebral artery (C, D, arrows) and distal right anterior cerebral artery (not shown) that was consistent with vasculitis. MRI, magnetic resonance imaging; FLAIR, Fluid Attenuated Inversion Recovery; GRE, gradient-echo; DSA, digital subtraction angiography.
Figure 17.
Figure 17.
Sulcal subarachnoid hemorrhage secondary to rupture of a right middle cerebral artery mycotic aneurysm. MRI (A-C) identifies sulcal SAH as hyperintense signal abnormality on the FLAIR sequence (A, arrow) and hypointense signal abnormality on the GRE sequence (B, arrow) within the left precentral sulcu. A post contrast volumetric image demonstrates a rounded area of enhancement along the course of the vessels within the left precentral sulcus (C, arrow) that represents a mycotic aneurysm. Cerebral DSA in the anteroposterior (D) and lateral (E, F) projections demonstrate a lobulated mycotic aneurysm arising from the left precentral artery (D-F, arrows). This mycotic aneurysm is best appreciated on the lateral magnified view (F, arrow). MRI, magnetic resonance imaging; SAH, subarachnoid hemorrhage; FLAIR, Fluid Attenuated Inversion Recovery; GRE, gradient-echo; DSA, digital subtraction angiography.

References

    1. van Asch CJ, Luitse MJ, Rinkel GJ, van der Tweel I, Algra A, Klijn CJ. Incidence, case fatality, and functional outcome of intracerebral haemorrhage over time, according to age, sex, and ethnic origin: a systematic review and meta-analysis. Lancet Neurol. 2010;9:167–176. - PubMed
    1. Shetty VS, Reis MN, Aulino JM, Berger KL, Broder J, Choudhri AF, et al. ACR appropriateness criteria head trauma. J Am Coll Radiol. 2016;13:668–679. - PubMed
    1. Orrison WW, Gentry LR, Stimac GK, Tarrel RM, Espinosa MC, Cobb LC. Blinded comparison of cranial CT and MR in closed head injury evaluation. AJNR Am J Neuroradiol. 1994;15:351–356. - PMC - PubMed
    1. Lee H, Wintermark M, Gean AD, Ghajar J, Manley GT, Mukherjee P. Focal lesions in acute mild traumatic brain injury and neurocognitive outcome: CT versus 3T MRI. J Neurotrauma. 2008;25:1049–1056. - PubMed
    1. Altmeyer W, Steven A, Gutierrez J. Use of magnetic resonance in the evaluation of cranial trauma. Magn Reson Imaging Clin N Am. 2016;24:305–323. - PubMed