. 2017 Jan;140(1):68-82.
doi: 10.1093/brain/aww280. Epub 2016 Nov 15.

Preoperative automated fibre quantification predicts postoperative seizure outcome in temporal lobe epilepsy

Affiliations

Preoperative automated fibre quantification predicts postoperative seizure outcome in temporal lobe epilepsy

Simon S Keller et al. Brain. 2017 Jan.

Abstract

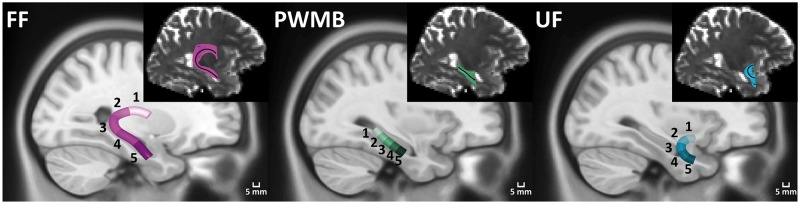
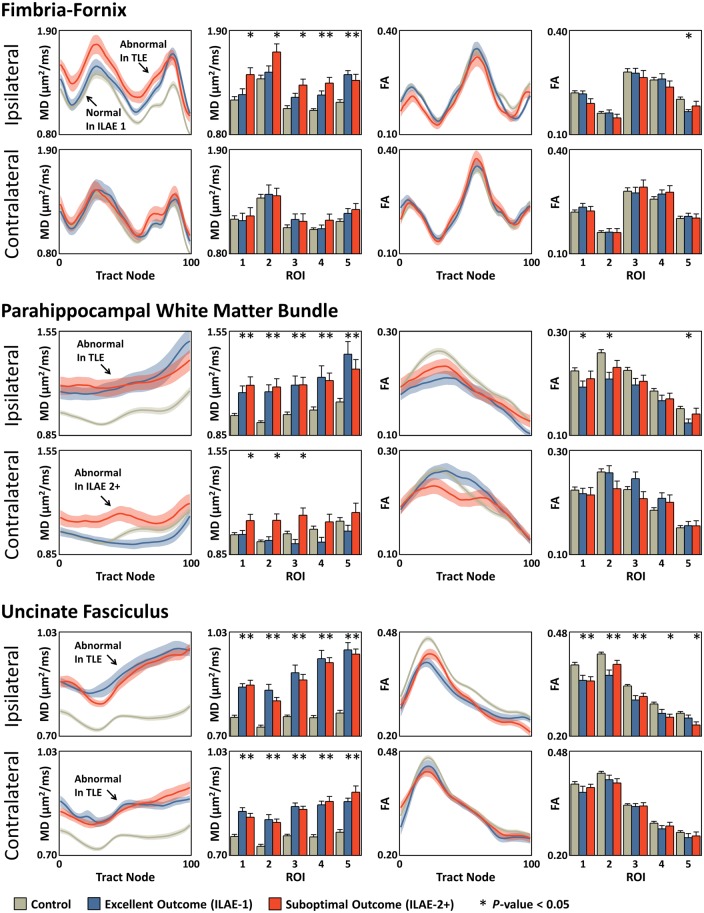
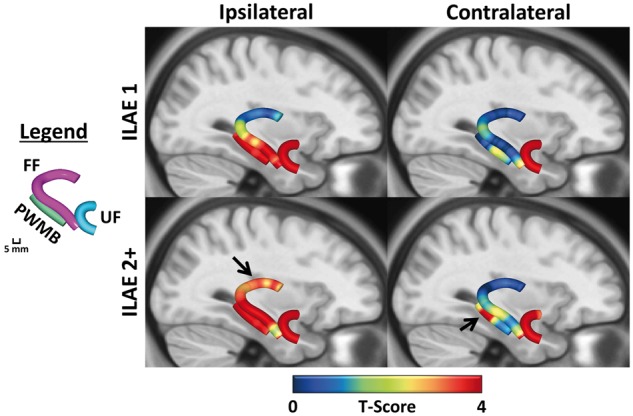
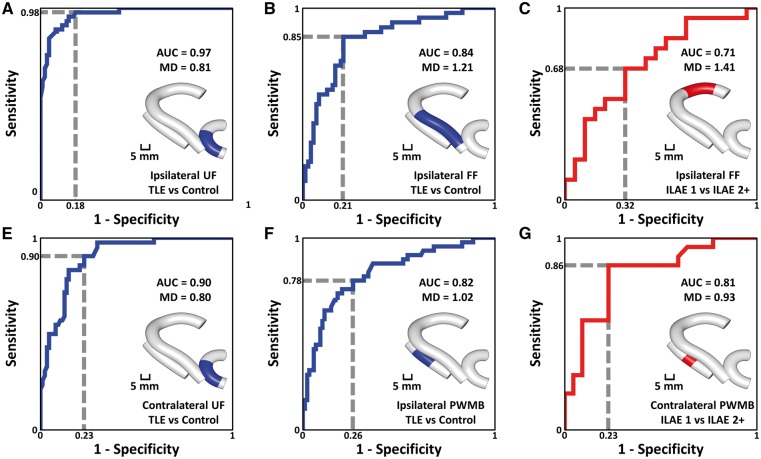
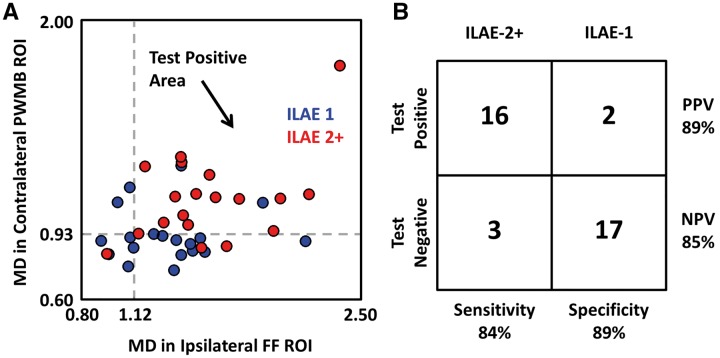
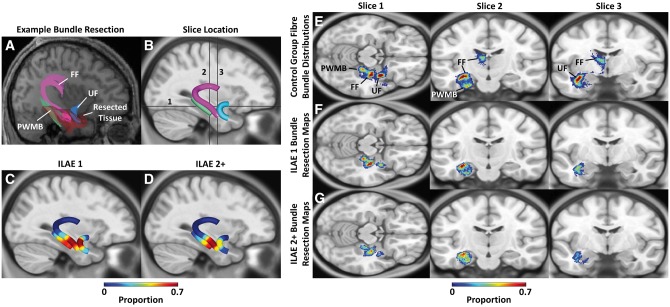
Approximately one in every two patients with pharmacoresistant temporal lobe epilepsy will not be rendered completely seizure-free after temporal lobe surgery. The reasons for this are unknown and are likely to be multifactorial. Quantitative volumetric magnetic resonance imaging techniques have provided limited insight into the causes of persistent postoperative seizures in patients with temporal lobe epilepsy. The relationship between postoperative outcome and preoperative pathology of white matter tracts, which constitute crucial components of epileptogenic networks, is unknown. We investigated regional tissue characteristics of preoperative temporal lobe white matter tracts known to be important in the generation and propagation of temporal lobe seizures in temporal lobe epilepsy, using diffusion tensor imaging and automated fibre quantification. We studied 43 patients with mesial temporal lobe epilepsy associated with hippocampal sclerosis and 44 healthy controls. Patients underwent preoperative imaging, amygdalohippocampectomy and postoperative assessment using the International League Against Epilepsy seizure outcome scale. From preoperative imaging, the fimbria-fornix, parahippocampal white matter bundle and uncinate fasciculus were reconstructed, and scalar diffusion metrics were calculated along the length of each tract. Altogether, 51.2% of patients were rendered completely seizure-free and 48.8% continued to experience postoperative seizure symptoms. Relative to controls, both patient groups exhibited strong and significant diffusion abnormalities along the length of the uncinate bilaterally, the ipsilateral parahippocampal white matter bundle, and the ipsilateral fimbria-fornix in regions located within the medial temporal lobe. However, only patients with persistent postoperative seizures showed evidence of significant pathology of tract sections located in the ipsilateral dorsal fornix and in the contralateral parahippocampal white matter bundle. Using receiver operating characteristic curves, diffusion characteristics of these regions could classify individual patients according to outcome with 84% sensitivity and 89% specificity. Pathological changes in the dorsal fornix were beyond the margins of resection, and contralateral parahippocampal changes may suggest a bitemporal disorder in some patients. Furthermore, diffusion characteristics of the ipsilateral uncinate could classify patients from controls with a sensitivity of 98%; importantly, by co-registering the preoperative fibre maps to postoperative surgical lacuna maps, we observed that the extent of uncinate resection was significantly greater in patients who were rendered seizure-free, suggesting that a smaller resection of the uncinate may represent insufficient disconnection of an anterior temporal epileptogenic network. These results may have the potential to be developed into imaging prognostic markers of postoperative outcome and provide new insights for why some patients with temporal lobe epilepsy continue to experience postoperative seizures.

Keywords: imaging; outcome; prognosis; seizures; surgery.


Figures

Figure 1
Figure 1
Anatomical location of fibre bundle regions of interest used for statistical comparison. The inset for each fibre bundle illustrates representative tracts reconstructed for a single subject, with the solid black line indicating the AFQ-identified tract core used for calculation of the tract profiles. Tract cores for each subject are mapped to a template image and averaged to indicate the group-wise representation of each fibre bundle. For statistical comparison, each fibre bundle is divided into five regions of interest by averaging every 20 consecutive tract sections. Region of interest numbers correspond to the regions of interest used in Fig. 2 and Supplementary Table 1. FF = fimbria-fornix; PWMB = parahippocampal white matter bundle; UF = uncinate fasciculus.
Figure 2
Figure 2
Mean diffusivity (MD) and fractional anisotropy (FA) tract profiles for mean (± SEM) ipsilateral and contralateral tracts in the ILAE 1 and ILAE 2+ groups relative to controls. The histograms indicate the average tract profile over a given region of interest. In all cases, increasing tract section corresponds to increasing region of interest number and the regions of interest correspond to those given in Fig. 1. *P-value < 0.05 compared to controls after correcting for multiple comparisons with the FDR procedure. Arrows highlight statistically significantly different regions in the mean diffusivity tract profiles.
Figure 3
Figure 3
Section-wise t-scores for mean diffusivity tract profiles. Differences between patient groups and controls are shown projected onto an anatomical template to illustrate the localization of alterations in Fig. 2. Red areas represent significantly increased mean diffusivity in respective patient groups relative to controls. Arrows indicate regions significantly different only in patients with a suboptimal outcome. FF = fimbria-fornix; PWMB = parahippocampal white matter bundle; UF = uncinate fasciculus.
Figure 4
Figure 4
ROC curves. In all cases, blue indicates separation between patient and control groups and red indicates separation between patient outcome groups. The area under curve (AUC) is used to assess quality of the ROC curves and the dashed line gives example sensitivity and 1-specificity calculations. MD represents mean diffusivity and the value indicates the corresponding test threshold in units of (µm2/ms). The inset for each curve indicates the location of the region of interest used to calculate the ROC curve, which was selected based on observed group differences in mean diffusivity. FF = fimbria-fornix; PWMB = parahippocampal white matter bundle; UF = uncinate fasciculus.
Figure 5
Figure 5
Combining ipsilateral dorsal fimbria-fornix and contralateral parahippocampal white matter bundle mean diffusivity values increases the sensitivity and specificity for separating patient outcome groups. (A) Mean diffusivity (MD) values in the ipsilateral dorsal fornix and contralateral parahippocampal white matter bundle (PWMB) are plotted on the x- and y-axes, respectively, for all patients in the ILAE 1 group (blue) and ILAE 2 group (red) using the regions of interest indicated for the respective tracts in Fig. 4C and G. A combined test was used to separate groups for patients with mean diffusivity (MD) >1.12 µm2/ms in the ipsilateral fornix and mean diffusivity >0.93 µm2/ms in the contralateral parahippocampal white matter bundle indicated by the grey dashed lines with positive test values occurring in the upper right-hand quadrant (black arrow). (B) Sensitivity, specificity, positive predictive value (PPV), and negative predictive value (NPV) indicate test performance, illustrating the potential clinical applicability for surgical outcome prediction. FF = fimbria-fornix; PWMB = parahippocampal white matter bundle; ROI = region of interest; UF = uncinate fasciculus.
Figure 6
Figure 6
Fibre bundle resection analysis. (A) Representative tractography data and resection volume overlaid on an individual patient’s T1-weighted image illustrate the fibre bundles of interest overlapping with the resected tissue volume in circumscribed regions along each tract. (B) Group-wise representation of fibre pathways of interest overlaid on a template image. (C and D) Section-wise representation of the extent of resected fibre bundles for the ILAE 1 and ILAE 2+ groups, respectively, indicate the region of these tracts typically resected. (E) Representative slices for the fibre bundle distributions of the reconstructed tracts in the control group illustrate the anatomical location of the fibre bundles of interest. (F and G) Fibre bundle resection maps for the ILAE 1 and ILAE 2+ groups, respectively illustrate the proportion of the fibre bundles resected. The location of the representative transverse and coronal slices are given by the black bars in B. FF = fimbria-fornix; PWMB = parahippocampal white matter bundle; UF = uncinate fasciculus.

Comment in

References

    1. Aggleton JP, Desimone R, Mishkin M. The origin, course, and termination of the hippocampothalamic projections in the macaque. J Comp Neurol 1986; 243: 409–21. - PubMed
    1. Ahmadi ME, Hagler DJ Jr McDonald CR, Tecoma ES, Iragui VJ, Dale AM, et al.Side matters: diffusion tensor imaging tractography in left and right temporal lobe epilepsy. AJNR Am J Neuroradiol 2009; 30: 1740–7. - PMC - PubMed
    1. Assaf BA, Mohamed FB, Abou-Khaled KJ, Williams JM, Yazeji MS, Haselgrove J, et al.Diffusion tensor imaging of the hippocampal formation in temporal lobe epilepsy. AJNR Am J Neuroradiol 2003; 24: 1857–62. - PMC - PubMed
    1. Aull-Watschinger S, Pataraia E, Czech T, Baumgartner C. Outcome predictors for surgical treatment of temporal lobe epilepsy with hippocampal sclerosis. Epilepsia 2008; 49: 1308–16. - PubMed
    1. Babb TL, Brown WJ, Pretorius J, Davenport C, Lieb JP, Crandall PH. Temporal lobe volumetric cell densities in temporal lobe epilepsy. Epilepsia 1984; 25: 729–40. - PubMed