. 2017 Mar;27(3):427-439.
doi: 10.1101/gr.212175.116. Epub 2016 Dec 28.

Transcription factor assisted loading and enhancer dynamics dictate the hepatic fasting response

Affiliations

Transcription factor assisted loading and enhancer dynamics dictate the hepatic fasting response

Ido Goldstein et al. Genome Res. 2017 Mar.

Abstract

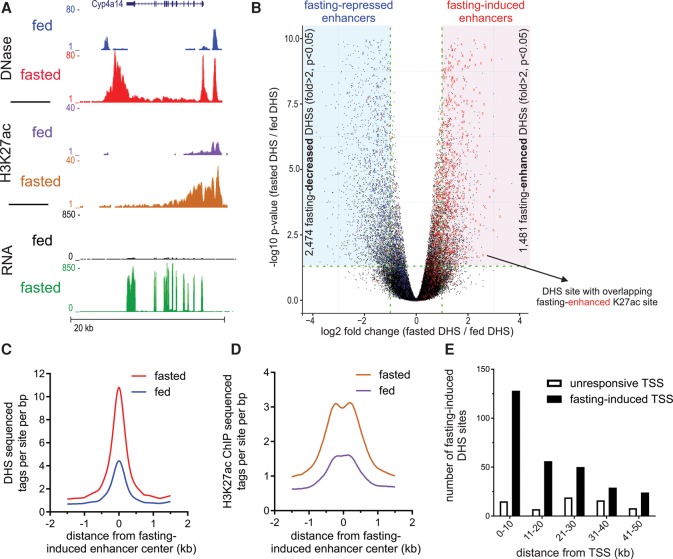
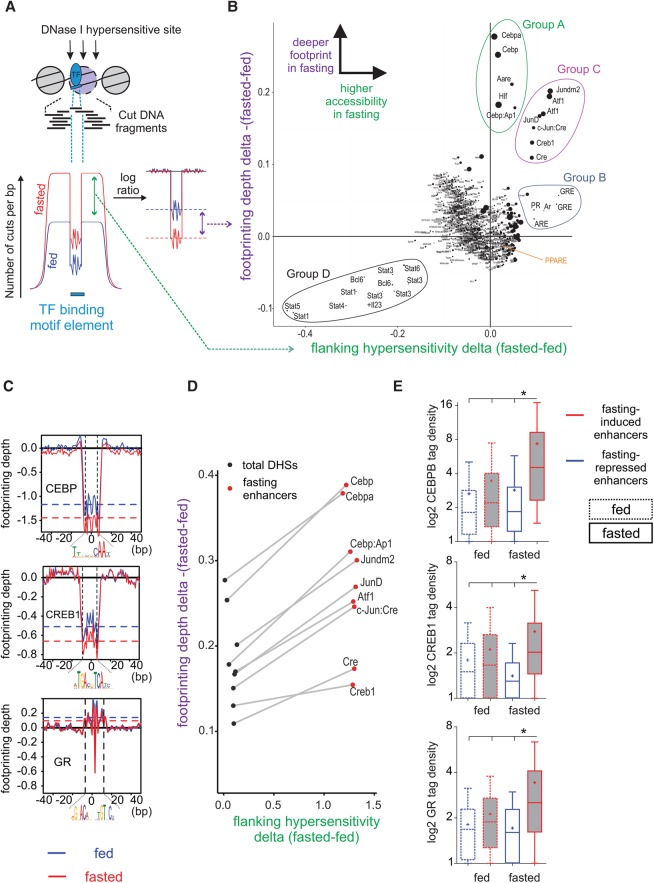
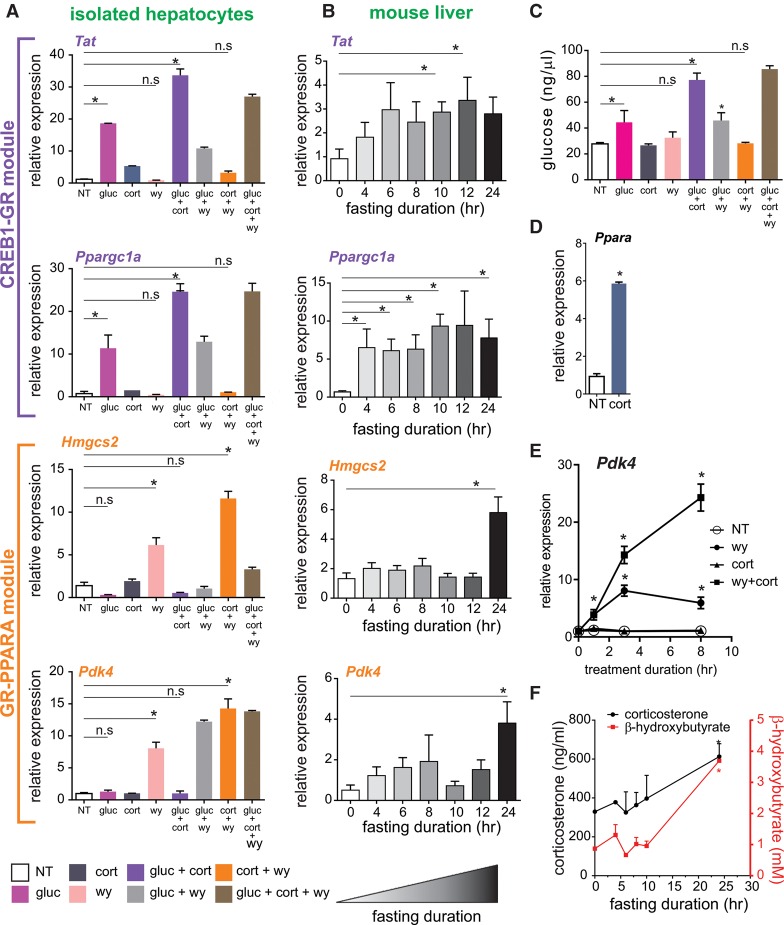
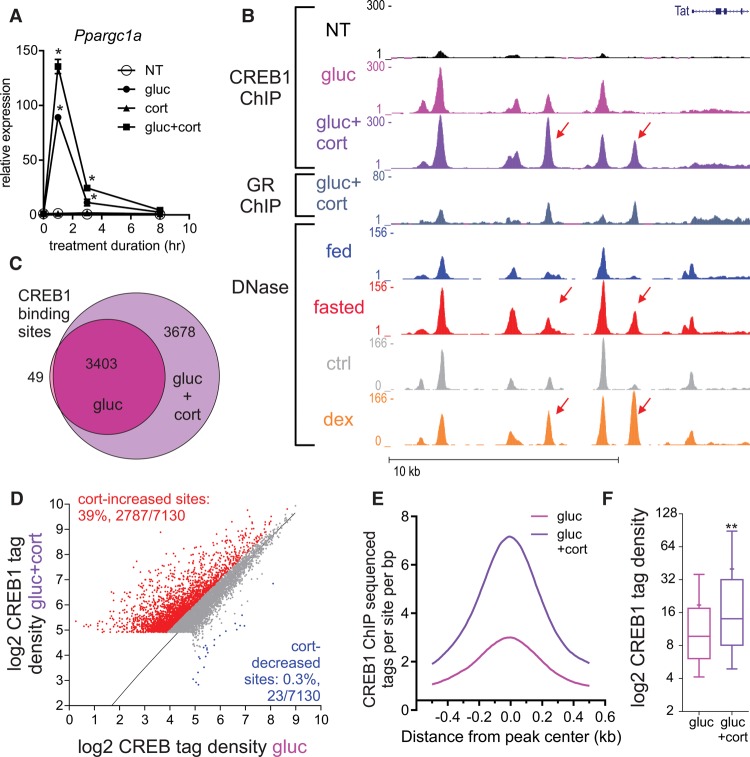
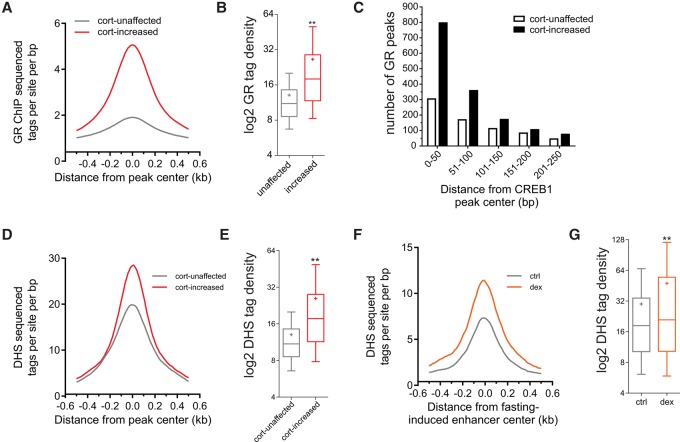
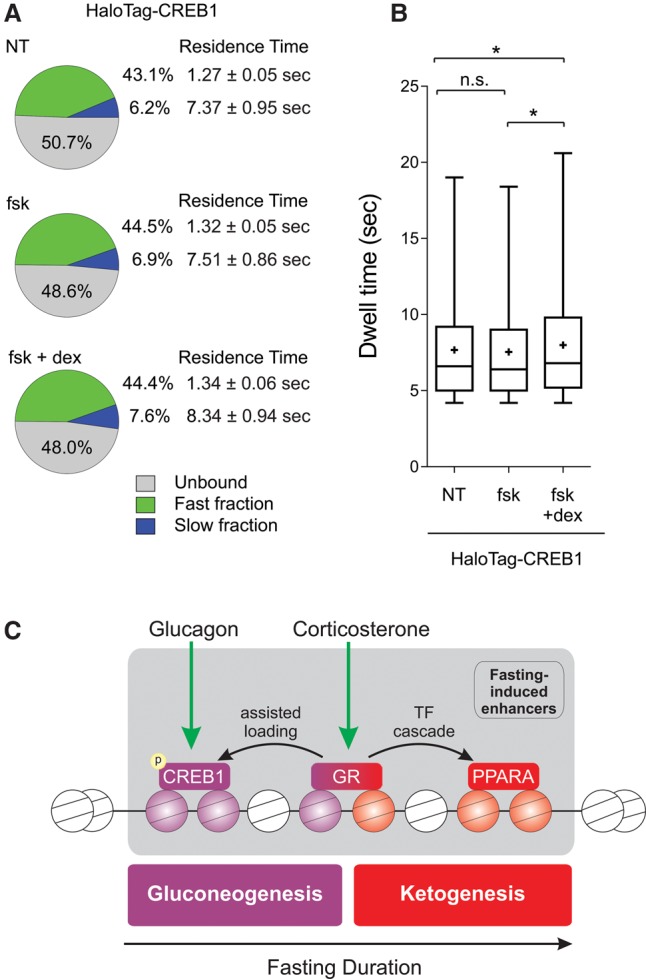
Fasting elicits transcriptional programs in hepatocytes leading to glucose and ketone production. This transcriptional program is regulated by many transcription factors (TFs). To understand how this complex network regulates the metabolic response to fasting, we aimed at isolating the enhancers and TFs dictating it. Measuring chromatin accessibility revealed that fasting massively reorganizes liver chromatin, exposing numerous fasting-induced enhancers. By utilizing computational methods in combination with dissecting enhancer features and TF cistromes, we implicated four key TFs regulating the fasting response: glucocorticoid receptor (GR), cAMP responsive element binding protein 1 (CREB1), peroxisome proliferator activated receptor alpha (PPARA), and CCAAT/enhancer binding protein beta (CEBPB). These TFs regulate fuel production by two distinctly operating modules, each controlling a separate metabolic pathway. The gluconeogenic module operates through assisted loading, whereby GR doubles the number of sites occupied by CREB1 as well as enhances CREB1 binding intensity and increases accessibility of CREB1 binding sites. Importantly, this GR-assisted CREB1 binding was enhancer-selective and did not affect all CREB1-bound enhancers. Single-molecule tracking revealed that GR increases the number and DNA residence time of a portion of chromatin-bound CREB1 molecules. These events collectively result in rapid synergistic gene expression and higher hepatic glucose production. Conversely, the ketogenic module operates via a GR-induced TF cascade, whereby PPARA levels are increased following GR activation, facilitating gradual enhancer maturation next to PPARA target genes and delayed ketogenic gene expression. Our findings reveal a complex network of enhancers and TFs that dynamically cooperate to restore homeostasis upon fasting.


Figures

Figure 1.
Figure 1.
Fasting substantially affects the hepatic chromatin landscape, exposing “fasting-induced enhancers.” (A) Genome browser tracks of the Cyp4a14 locus depicting increases in DNase I hypersensitivity, H3K27 acetylation, and RNA levels upon fasting (24 h; three animals were assayed in each group). (B) Volcano plot of all hepatic DNase I hypersensitive sites. DHS sites within the shaded areas show a significant change in accessibility upon fasting (twofold or greater, adjusted P-value ≤0.05). DHS sites overlapping with fasting-induced H3K27ac sites are depicted by a red X. These DHS sites tend themselves to be enhanced by fasting (mostly to the right). DHS sites overlapping with fasting-repressed H3K27ac sites are depicted by a blue X. These DHS sites tend themselves to be decreased by fasting (mostly to the left). (C,D) DHS (C) and H3K27ac (D) ChIP-seq tag density at fasting-induced enhancers in the fed and fasted states. (E) The number of DHS sites in the vicinity of fasting-induced genes (n = 1055) or unresponsive genes (random set, n = 1055) was plotted as a function of distance from gene transcriptional start site (TSS; plotted in 10-kb bins).
Figure 2.
Figure 2.
An unbiased method for detecting differences in footprinting depth and motif-flanking accessibility reveals the key TFs that bind at fasting-induced enhancers following fasting. (A,B) The number of DNase I cuts (i.e., “cut count”) is collected at and around a motif (±100 bp from motif center) in all motif occurrences within DHS sites. This cut count profile is then compared between the fed and fasted conditions, and a delta value is given for each motif (x-axis in the scatter plot). Then, a log ratio between the observed and expected (due to DNase I cut bias) cut counts at the motif is calculated. This ratio is normalized to provide a reliable footprint depth value that is unaffected by surrounding hypersensitivity (Methods). The delta value between footprint depth in the fasted and fed conditions is then given for each motif (y-axis in the scatter plot). The bigger the size of the circle marking the motif, the deeper the footprint is in the fasted state. Cut count data for B were pooled from three replicates. When single replicates were used, the observed pattern was similar (Supplemental Fig. S1D). (C) Individual normalized footprint depth aggregate plots for the CEBP, CRE, and GRE motifs. Footprint depth is illustrated with horizontal dashed lines: (red) fasted; (blue) fed. (D) Scatter plot depicting changes in footprint depth and hypersensitivity of fasting-related motifs in total liver DHS sites compared to fasting-induced enhancers. (E) Extent of CEBPB, CREB1, and GR binding (measured by ChIP-seq tag density) at fasting-responsive enhancers in liver following fasting (24 h).
Figure 3.
Figure 3.
The transcriptional response to fasting in liver is comprised of two TF modules. (A) Nascent RNA levels of fasting-induced genes in primary hepatocytes following a 3-h treatment with different combinations of glucagon (gluc), corticosterone (cort), and WY-14643 (wy). (B) Time course of fasting-induced genes shows an early induction of gluconeogenic genes and a later induction of FAO/ketogenic genes in liver. (C) Glucose production in primary hepatocytes following treatment with different combinations of glucagon, corticosterone, and WY-14643. (D) Nascent RNA levels of Ppara following corticosterone treatment (3 h) in primary hepatocytes. (E) Nascent RNA levels of Pdk4 in primary hepatocytes following 1, 3, and 8 h of treatment with different combinations of WY-14643 and corticosterone: (*) statistical significance (P ≤ 0.05) compared to a nontreated sample (NT) in each time point. (F) Time course of serum corticosterone and β-hydroxybutyrate levels during fasting: (*) statistical significance (P ≤ 0.05) compared to control values (fed). (n.s.) Not significant.
Figure 4.
Figure 4.
Corticosterone increases the number of CREB1 binding sites and CREB1 binding intensity. (A) Nascent RNA levels of Ppargc1a in primary hepatocytes following 1, 3, and 8 h of treatment with different combinations of glucagon (gluc) and corticosterone (cort): (*) statistical significance (P ≤ 0.05) compared to a nontreated sample (NT) in each time point. (B) Genome browser tracks of the Tat locus depicting increases in CREB1 binding following glucagon treatment (1 h) and cotreatment with corticosterone (1 h) as well as increased accessibility following either fasting or GR activation by dexamethasone (dex). Adrenalectomized mice were treated with dex (1 mg/kg) for 1 h, DNase-seq data were generated and described in Grøntved et al. (2013). (C,D) Cotreatment with glucagon and corticosterone leads to an increase in the number (C) and intensity (D) of CREB1 binding sites. (E,F) Corticosterone-increased CREB1 binding sites show more CREB1 binding than corticosterone-unaffected sites (measured by ChIP-seq tag density). (**) Statistical significance (P ≤ 0.0001).
Figure 5.
Figure 5.
GR binds at corticosterone-increased binding sites and increases their accessibility. (A,B) Corticosterone-increased CREB1 binding sites show more GR binding than corticosterone-unaffected sites (measured by ChIP-seq tag density). (**) Statistical significance (P ≤ 0.0001). (C) The number of GR peaks in the vicinity of cort-unaffected or cort-increased CREB1 peaks was plotted as a function of distance from CREB1 peak center (plotted in 50-bp bins). (D,E) Corticosterone-increased CREB1 binding sites show more DNase I hypersensitivity than corticosterone-unaffected sites in livers from adrenalectomized mice treated with dexamethasone (dex, 1 mg/kg) for 1 h, DNase-seq data were generated and described in Grøntved et al. (2013) (measured by DNase-seq tag density). (**) Statistical significance (P ≤ 0.0001). (F,G) GR increases DNase I hypersensitivity at fasting-induced enhancers (measured by DNase-seq tag density). Adrenalectomized mice were treated with dexamethasone (dex, 1 mg/kg) for 1 h, DNase-seq data were generated and described in Grøntved et al. (2013). (**) Statistical significance (P ≤ 0.0001).
Figure 6.
Figure 6.
GR increases the number and residence time of CREB1 molecules. (A) Summary of single-molecule tracking data. The percentage of the unbound, fast-bound, and slow-bound fractions as well as each fraction's average residence time is depicted under different treatments: (fsk) forskolin; (dex) dexamethasone. (B) Box plot depicting dwell time distributions of CREB1 molecules under different treatments. (*) Statistical significance (P ≤ 0.05) compared to indicated sample. (n.s.) Not significant. (C) A model for hepatic TF dynamics during fasting. The liver is exposed to glucagon in early fasting, leading to CREB1 activation by phosphorylation. At midterm fasting, GR is activated by increasing levels of corticosterone leading to two trajectories: First, GR assists the loading of CREB1 onto gluconeogenic enhancers resulting in synergized gluconeogenic gene expression and glucose production; and second, GR induces the gene level of PPARA which, as fasting persists, promotes a FAO/ketogenic gene program.

Comment in

References

    1. Altarejos JY, Montminy M. 2011. CREB and the CRTC co-activators: sensors for hormonal and metabolic signals. Nat Rev Mol Cell Biol 12: 141–151. - PMC - PubMed
    1. Anders S, Huber W. 2010. Differential expression analysis for sequence count data. Genome Biol 11: R106. - PMC - PubMed
    1. Baek S, Sung MH, Hager GL. 2012. Quantitative analysis of genome-wide chromatin remodeling. Methods Mol Biol 833: 433–441. - PMC - PubMed
    1. Bahar Halpern K, Tanami S, Landen S, Chapal M, Szlak L, Hutzler A, Nizhberg A, Itzkovitz S. 2015. Bursty gene expression in the intact mammalian liver. Mol Cell 58: 147–156. - PMC - PubMed
    1. Biddie SC, John S, Sabo PJ, Thurman RE, Johnson TA, Schiltz RL, Miranda TB, Sung MH, Trump S, Lightman SL, et al. 2011. Transcription factor AP1 potentiates chromatin accessibility and glucocorticoid receptor binding. Mol Cell 43: 145–155. - PMC - PubMed

Publication types

MeSH terms