. 2017 Mar;27(3):462-470.
doi: 10.1101/gr.211169.116. Epub 2016 Dec 28.

A-to-I RNA editing promotes developmental stage-specific gene and lncRNA expression

Affiliations

A-to-I RNA editing promotes developmental stage-specific gene and lncRNA expression

Boaz Goldstein et al. Genome Res. 2017 Mar.

Abstract

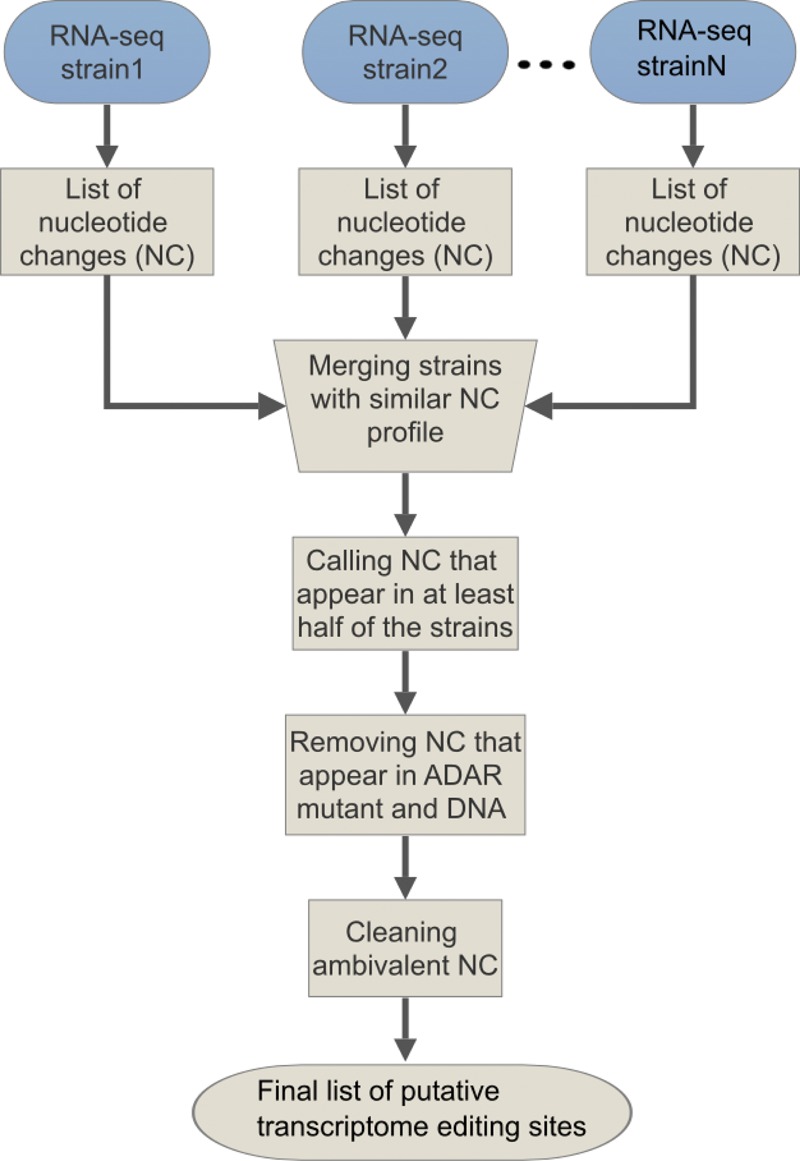
A-to-I RNA editing is a conserved widespread phenomenon in which adenosine (A) is converted to inosine (I) by adenosine deaminases (ADARs) in double-stranded RNA regions, mainly noncoding. Mutations in ADAR enzymes in Caenorhabditis elegans cause defects in normal development but are not lethal as in human and mouse. Previous studies in C. elegans indicated competition between RNA interference (RNAi) and RNA editing mechanisms, based on the observation that worms that lack both mechanisms do not exhibit defects, in contrast to the developmental defects observed when only RNA editing is absent. To study the effects of RNA editing on gene expression and function, we established a novel screen that enabled us to identify thousands of RNA editing sites in nonrepetitive regions in the genome. These include dozens of genes that are edited at their 3' UTR region. We found that these genes are mainly germline and neuronal genes, and that they are down-regulated in the absence of ADAR enzymes. Moreover, we discovered that almost half of these genes are edited in a developmental-specific manner, indicating that RNA editing is a highly regulated process. We found that many pseudogenes and other lncRNAs are also extensively down-regulated in the absence of ADARs in the embryo but not in the fourth larval (L4) stage. This down-regulation is not observed upon additional knockout of RNAi. Furthermore, levels of siRNAs aligned to pseudogenes in ADAR mutants are enhanced. Taken together, our results suggest a role for RNA editing in normal growth and development by regulating silencing via RNAi.


Figures

Figure 1.
Figure 1.
Schematic view of the computational pipeline for identification of A-to-I RNA editing sites.
Figure 2.
Figure 2.
Nucleotide changes found by the computational pipeline. Bar graphs represent nucleotide changes found by using the computational pipeline at nonrepetitive regions (A) or repetitive regions (B). A-to-G and T-to-C changes (from antiparallel transcripts) indicate possible RNA editing sites. Sites found in mixed-stage worms (blue), embryos (green), and L4 larval stage (red). (C) A Venn diagram presenting the intersection between A-to-I editing sites found by repetitive (Rep align) and nonrepetitive alignments (Non-Rep align). Most of the nonrepetitive sites were also found by the repetitive analysis.
Figure 3.
Figure 3.
Most of the editing sites in nonrepetitive regions are located in intergenic and intronic regions or at 3′ UTR in gene transcripts. (A) Pie graph presenting the distribution of editing sites that were found by nonrepetitive alignment to the genome. Except for sites in intergenic regions that are not assigned to genes, all other sites were annotated as either sense or antisense (AS) to the assigned gene. (B) Distribution of editing sites located in gene transcripts, 5′ UTR, coding, or 3′ UTR regions. Sites were separated based on the region and orientation to the gene, sense, or antisense (AS). (C,D) Visualization of editing sites found at the 3′ UTR of the F48E8.4 gene. 3′ UTR of the gene is presented by arrows. (C) Sequences from wild-type worms. (D) Sequences from ADAR mutant worms. Red bars represent reads aligned to the 3′ UTR of F48E8.4 by nonrepetitive alignment from one library used in this study. Yellow lines are the predicted editing sites by this analysis. Blue dots on the sequences show A-to-G nucleotide changes, and orange dots show other nucleotide changes found in the sequences. Regions that do not have sequence coverage are repetitive regions. Therefore, sequences that aligned to them also aligned to other regions in the genome and were excluded from the analysis. The general abundance of A-to-G mismatches in the edited area can be observed in the wild type, in contrast to the complete lack of such changes in the ADAR mutant.
Figure 4.
Figure 4.
Genes edited at their 3′ UTR are down-regulated in ADAR mutant worms; pseudogenes are down-regulated only at embryo stage. Log scale plots presenting expression of genes in wild-type (N2) worms versus ADAR mutant worm at embryo stage (A,C) or L4 larval stage (B,D). Every dot in the graphs represents a gene. The red line is the regression line for all genes. 3′ UTR-edited genes with one editing site are in green, and the regression line is presented in green. 3′ UTR-edited genes with multiple editing sites are in blue, and the regression line is presented in blue. Purple dots indicate pseudogenes and lncRNAs, and the regression line is presented in purple.
Figure 5.
Figure 5.
Pseudogenes do not exhibit down-regulation in ADAR and RNAi mutants at the embryo stage. Log scale plots comparing gene expression of wild-type (N2) worms to adr-1(−/−);adr-2(−/−);rde-1(−/−) (A) or adr-1(−/−);adr-2(−/−);rde-4(−/−) (B) mutant worms at the embryo stage of development. (C) Log scale plot comparing primary siRNA expression of wild-type (N2) worms to adr-1(−/−);adr-2(−/−) mutant worms. Every dot represents a gene. The red line is the regression line for all genes. Purple dots indicate pseudogenes and the regression line is presented in purple.
Figure 6.
Figure 6.
Some of the editing sites show developmental stage specificity, which is not caused by differential expression. (A) Overlap between 3′ UTR-edited genes found in each RNA-sequencing data set. The number of edited genes identified from RNA isolated from L4, embryo, and mixed stages is shown in purple, pink, and blue, respectively. The numbers inside the overlapping circles represent the intersection between the data sets. (B) Log scale plot presenting expression of genes at L4 and embryo stage in wild-type (N2) worms. Every dot represents a gene. Purple dots indicate L4-specific edited genes. Pink dots indicate embryo-specific edited genes. The green dot is egl-2 gene. The red line is the regression line for all genes.

References

    1. Alon S, Mor E, Vigneault F, Church GM, Locatelli F, Galeano F, Gallo A, Shomron N, Eisenberg E. 2012. Systematic identification of edited microRNAs in the human brain. Genome Res 22: 1533–1540. - PMC - PubMed
    1. Anders S, Huber W. 2010. Differential expression analysis for sequence count data. Genome Biol 11: R106. - PMC - PubMed
    1. Athanasiadis A, Rich A, Maas S. 2004. Widespread A-to-I RNA editing of Alu-containing mRNAs in the human transcriptome. PLoS Biol 2: e391. - PMC - PubMed
    1. Barak M, Levanon EY, Eisenberg E, Paz N, Rechavi G, Church GM, Mehr R. 2009. Evidence for large diversity in the human transcriptome created by Alu RNA editing. Nucleic Acids Res 37: 6905–6915. - PMC - PubMed
    1. Barkan R, Zahand AJ, Sharabi K, Lamm AT, Feinstein N, Haithcock E, Wilson KL, Liu J, Gruenbaum Y. 2012. Ce-emerin and LEM-2: essential roles in Caenorhabditis elegans development, muscle function, and mitosis. Mol Biol Cell 23: 543–552. - PMC - PubMed

Publication types

MeSH terms