. 2017 Mar 1;215(5):732-739.
doi: 10.1093/infdis/jiw642.

Contact, Travel, and Transmission: The Impact of Winter Holidays on Influenza Dynamics in the United States

Affiliations

Contact, Travel, and Transmission: The Impact of Winter Holidays on Influenza Dynamics in the United States

Anne Ewing et al. J Infect Dis. .

Abstract

Background: The seasonality of influenza is thought to vary according to environmental factors and human behavior. During winter holidays, potential disease-causing contact and travel deviate from typical patterns. We aim to understand these changes on age-specific and spatial influenza transmission.

Methods: We characterized the changes to transmission and epidemic trajectories among children and adults in a spatial context before, during, and after the winter holidays among aggregated physician medical claims in the United States from 2001 to 2009 and among synthetic data simulated from a deterministic, age-specific spatial metapopulation model.

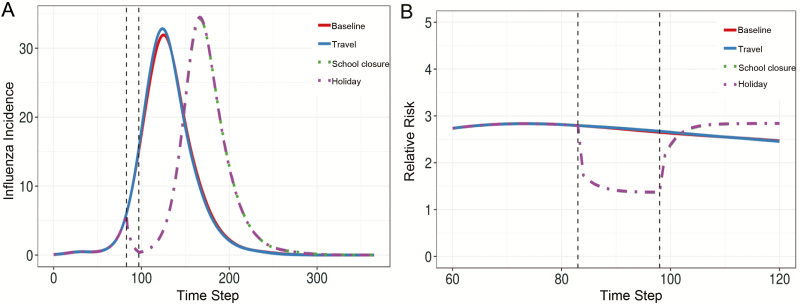
Results: Winter holidays reduced influenza transmission and delayed the trajectory of influenza season epidemics. The holiday period was marked by a shift in the relative risk of disease from children toward adults. Model results indicated that holidays delayed epidemic peaks and synchronized incidence across locations, and that contact reductions from school closures, rather than age-specific mixing and travel, produced these observed holiday influenza dynamics.

Conclusions: Winter holidays delay seasonal influenza epidemic peaks and shift disease risk toward adults because of changes in contact patterns. These findings may inform targeted influenza information and vaccination campaigns during holiday periods.

Keywords: age patterns; epidemiology; influenza; travel patterns; winter holidays; United States.


Figures

Figure 1.
Figure 1.
Decreases in transmission are observed following Christmas. A, National influenza-like illness (ILI) incidence ratio (calculated as the number of ILI cases per total number visits per 100 000 population) calculated using weekly ILI medical claims data from the first week in November to the last week in January for influenza seasons 2001–2009. The week of Christmas is marked with the dashed line. B, National daily effective reproductive number (Rt) over time from November to January for influenza seasons from 2001 to 2009. (Rt) was calculated over 7-day windows, using ILI medical claims data adjusted for healthcare facility closures and care-seeking behavior. The date of Christmas is marked with the dashed line.
Figure 2.
Figure 2.
The impact of the holidays varies by age group. A, Age-specific influenza-like illness (ILI) incidence ratio calculated from weekly ILI medical claims data from November to January for influenza seasons 2001–2009 among school-aged children and adults. The week of Christmas is denoted by the dashed line. B, The risk of incident ILI among school-aged children relative to that among adults calculated over time in weeks from November to January, using medical claims data for influenza seasons 2001–2009. The week of Christmas is denoted by the dashed line. A relative risk of >1 indicates a greater risk among children, with a value of <1 indicating greater risk among adults.
Figure 3.
Figure 3.
Peak timing and spatial synchrony in empirical data. A, Distribution of weeks to peak timing of influenza epidemics across all 3-digit US zip code prefixes (zip3s) during the influenza season (ie, from October to March). Distributions are compared across 8 influenza seasons in the study period. The horizontal dashed lines highlight the holiday period. B, Distributions of ILI reports across all zip3s for the mean of the 2-week durations before, during, and after the holiday periods. Distributions are compared across 8 influenza seasons in the study period. A small number of outlying data points are not depicted here.
Figure 4.
Figure 4.
Changes to contact patterns appear to drive holiday-associated dynamics in model simulations. A, The total influenza incidence per 10 000 population over time, where the mean was taken across all model runs. B, The risk of disease among children relative to that among adults across all locations, where the mean was taken across all model runs. Epidemic trajectories for the baseline (no changes during the holiday period), travel only, school closure only, and full holiday (travel and school closure changes) models are compared, and the holiday period is demarcated by the dashed black lines. Solid lines represent the baseline and travel simulations, while dot-dashed lines represent the school closure and holiday simulations.
Figure 5.
Figure 5.
Holiday-associated behavioral changes delay peak timing and increase the synchrony of epidemics across locations in model simulations. A, Distribution of time steps (days) to peak timing of influenza epidemics across all metropolitan areas, where the mean was taken across all model runs. Distributions across metropolitan areas are compared for the baseline, travel only, contact only, and full holiday models, and the holiday period is demarcated by the horizontal black lines. B, Distributions of influenza incidence across all metropolitan areas for the mean of for the 2-week durations before, during, and after the holiday periods, where the mean was taken across all model runs (for each simulation, left, middle, and right, respectively). Distributions are compared for the baseline, travel only, school closure only, and full holiday models.

Comment in

Similar articles

Cited by

References

    1. Lee EC, Viboud C, Simonsen L, Khan F, Bansal S. Detecting signals of seasonal influenza severity through age dynamics. BMC Infect Dis 2015; 15:587. - PMC - PubMed
    1. Stark JH, Cummings DA, Ermentrout B, et al. Local variations in spatial synchrony of influenza epidemics. PLoS One 2012; 7:e43528. - PMC - PubMed
    1. Viboud C, Bjørnstad ON, Smith DL, Simonsen L, Miller MA, Grenfell BT. Synchrony, waves, and spatial hierarchies in the spread of influenza. Science 2006; 312:447–51. - PubMed
    1. Apolloni A, Poletto C, Colizza V. Age-specific contacts and travel patterns in the spatial spread of 2009 H1N1 influenza pandemic. BMC Infect Dis 2013; 13:176. - PMC - PubMed
    1. Schanzer D, Vachon J, Pelletier L. Age-specific differences in influenza A epidemic curves: do children drive the spread of influenza epidemics? Am J Epidemiol 2011; 174:109–17. - PMC - PubMed