. 2017 Mar 1;37(6):e00500-16.
doi: 10.1128/MCB.00500-16. Print 2017 Mar 15.

INPP5E Preserves Genomic Stability through Regulation of Mitosis

Affiliations

INPP5E Preserves Genomic Stability through Regulation of Mitosis

Elizabeth A Sierra Potchanant et al. Mol Cell Biol. .

Erratum in

Abstract

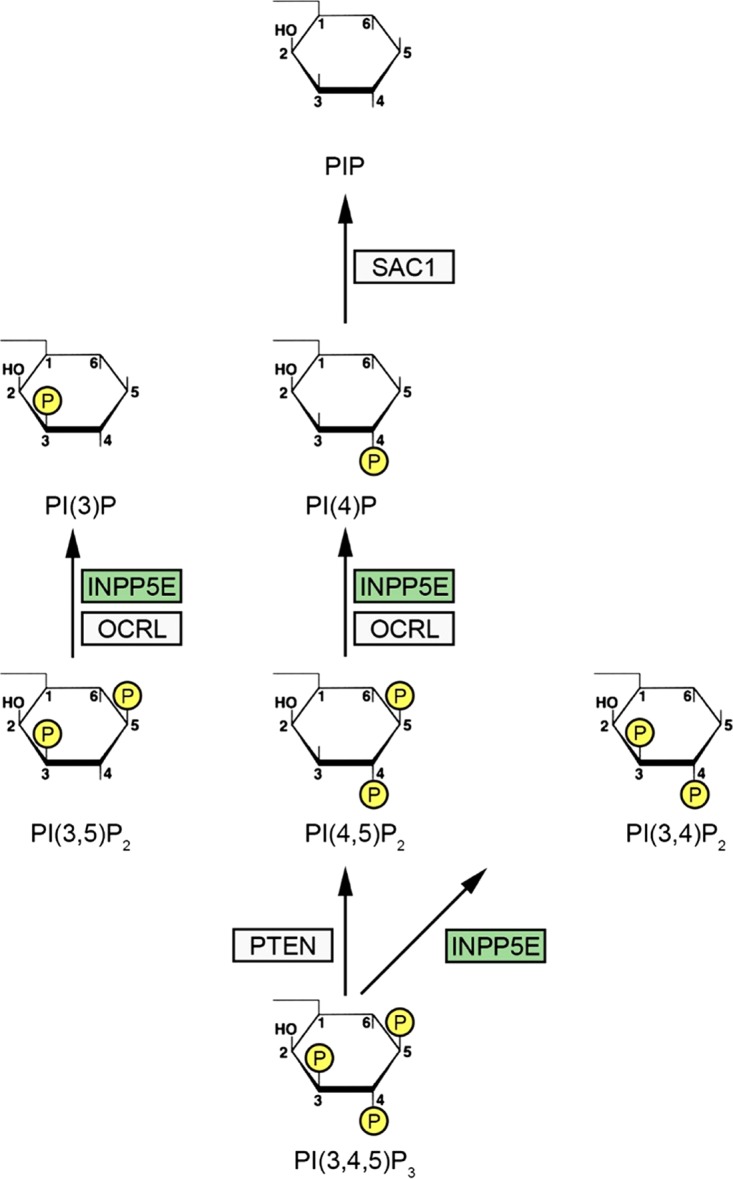
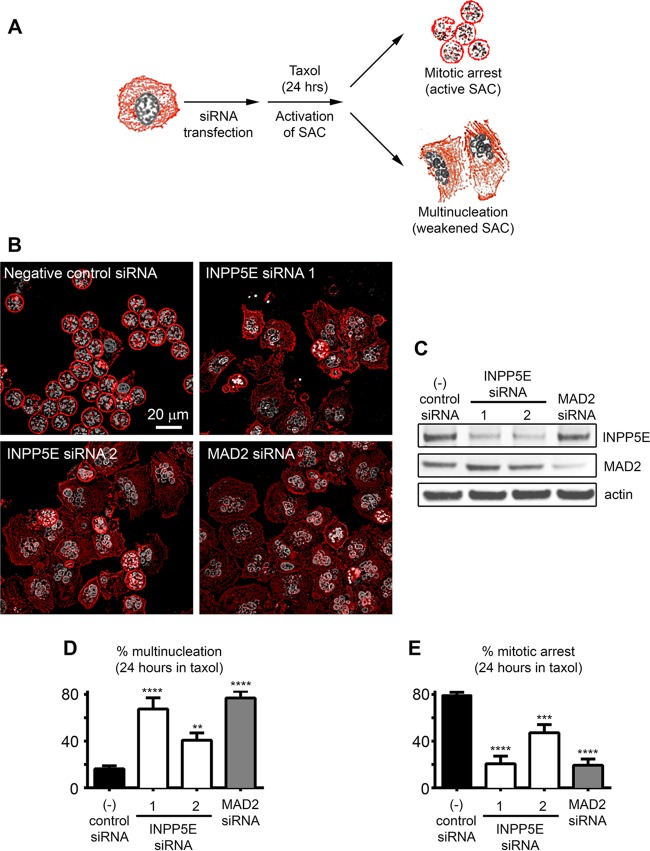
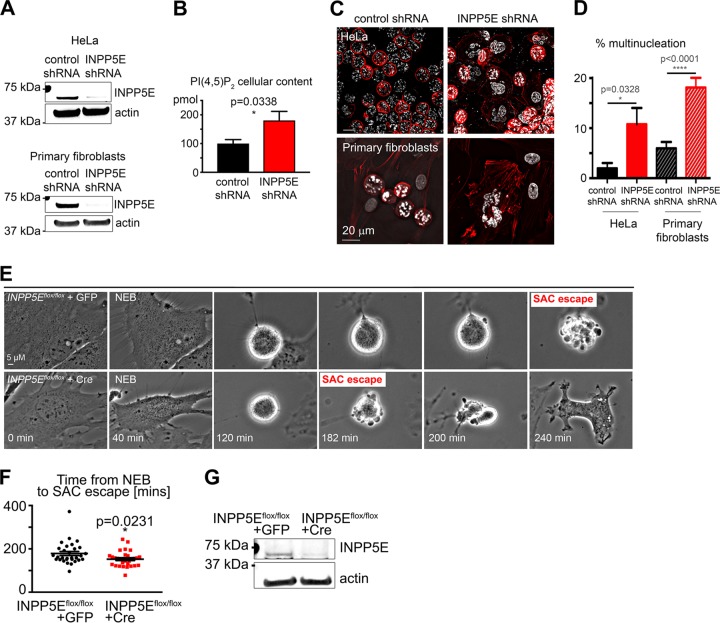
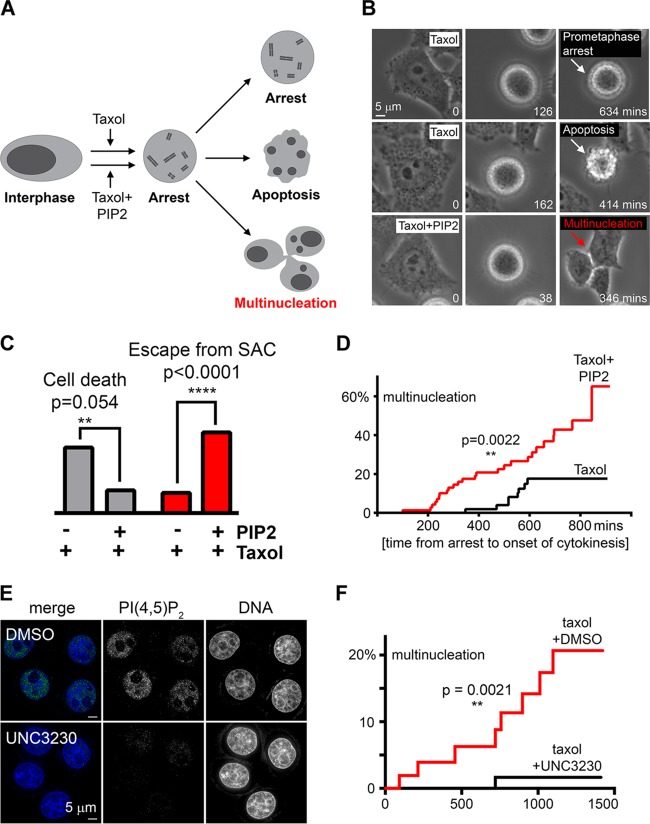
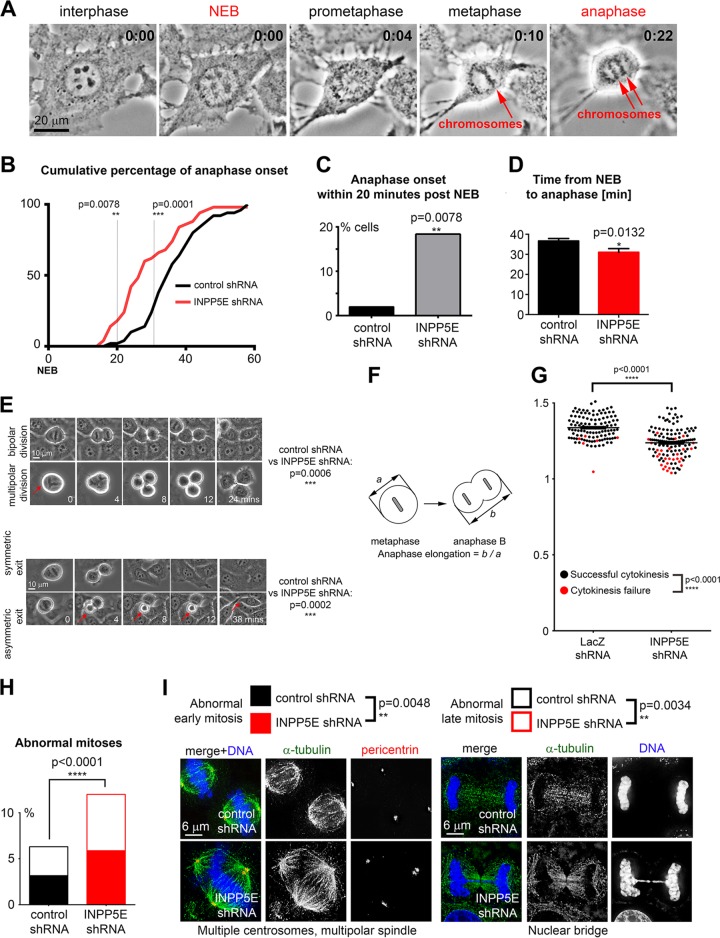
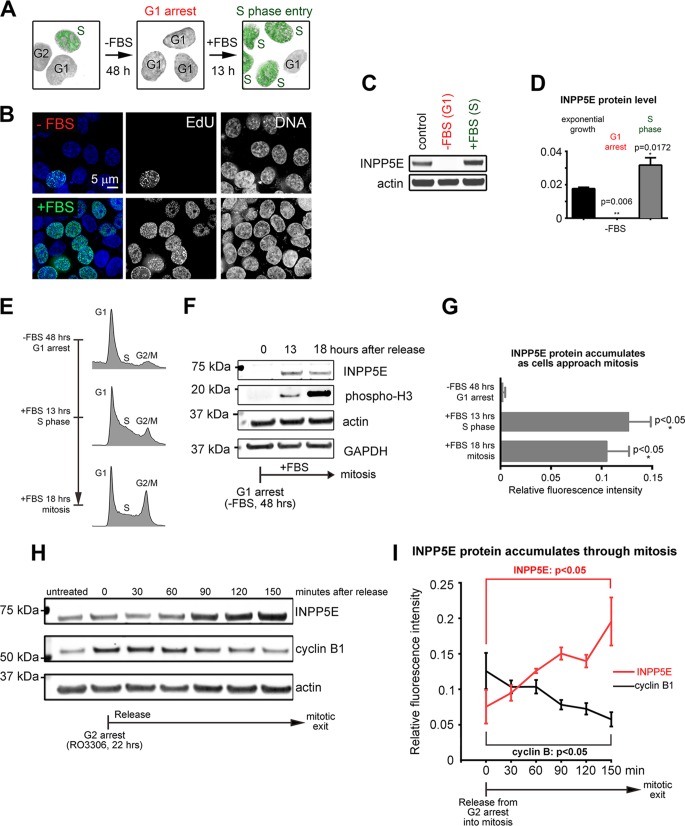
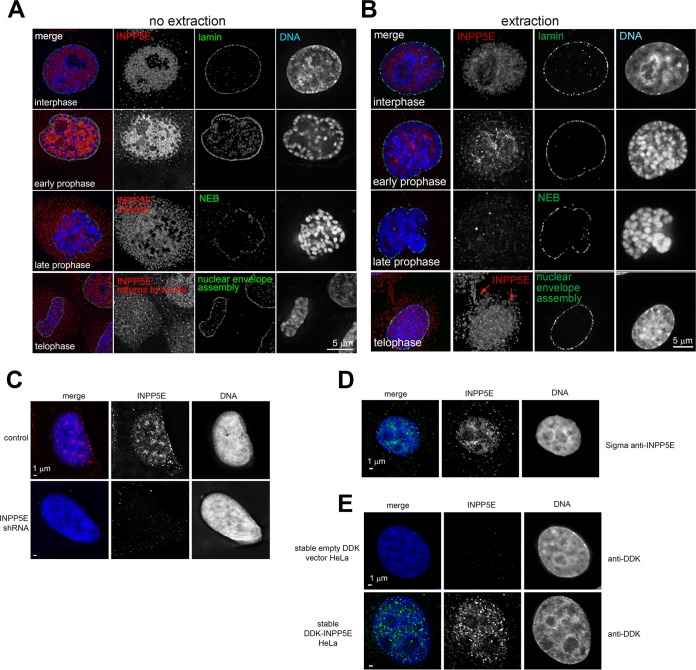
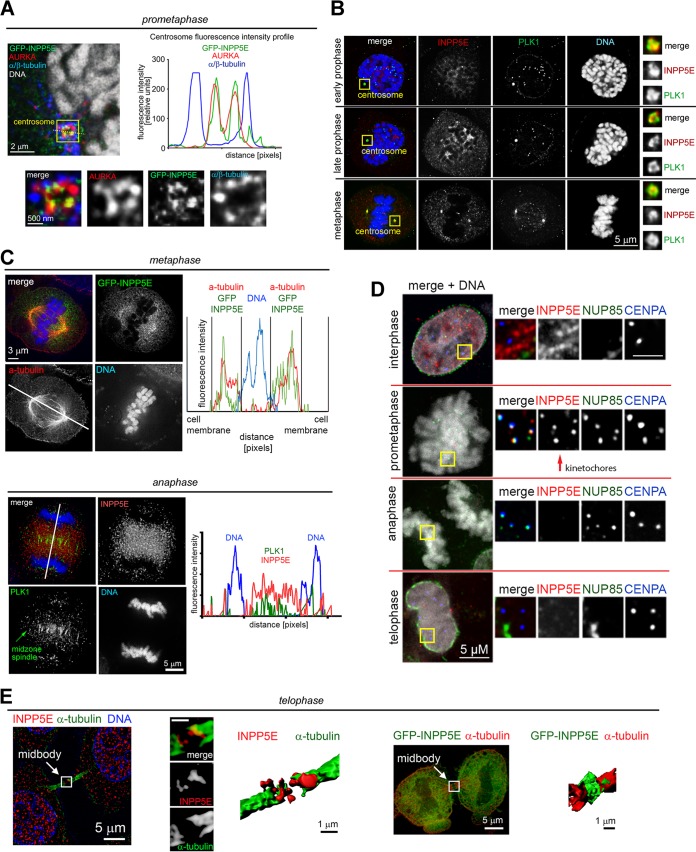
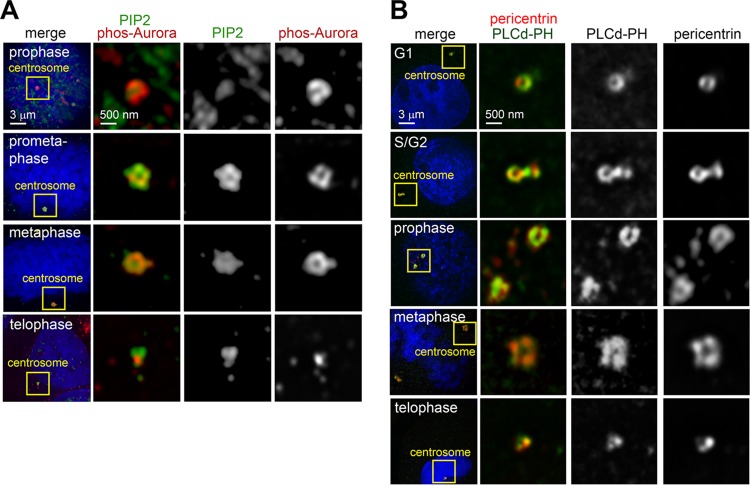
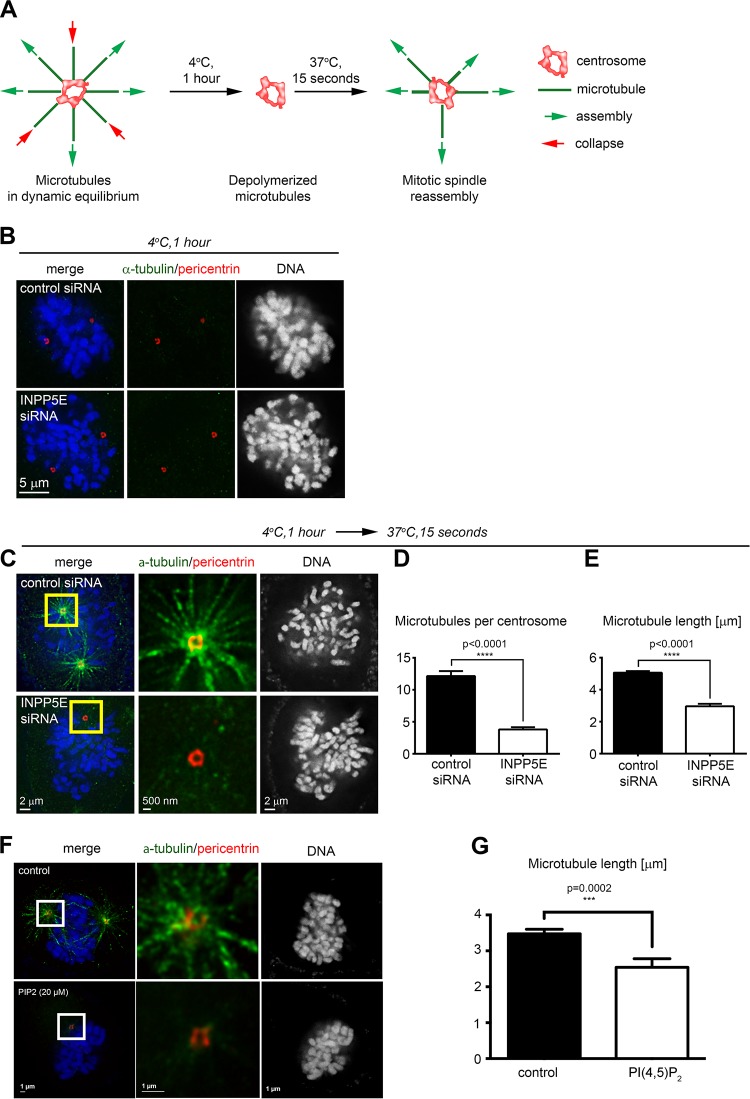
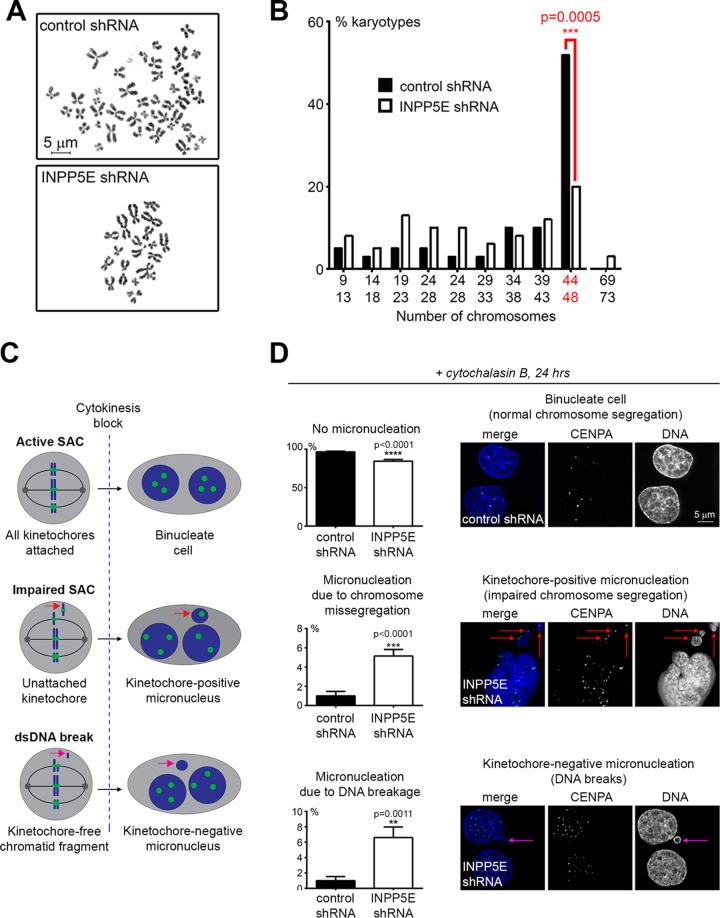
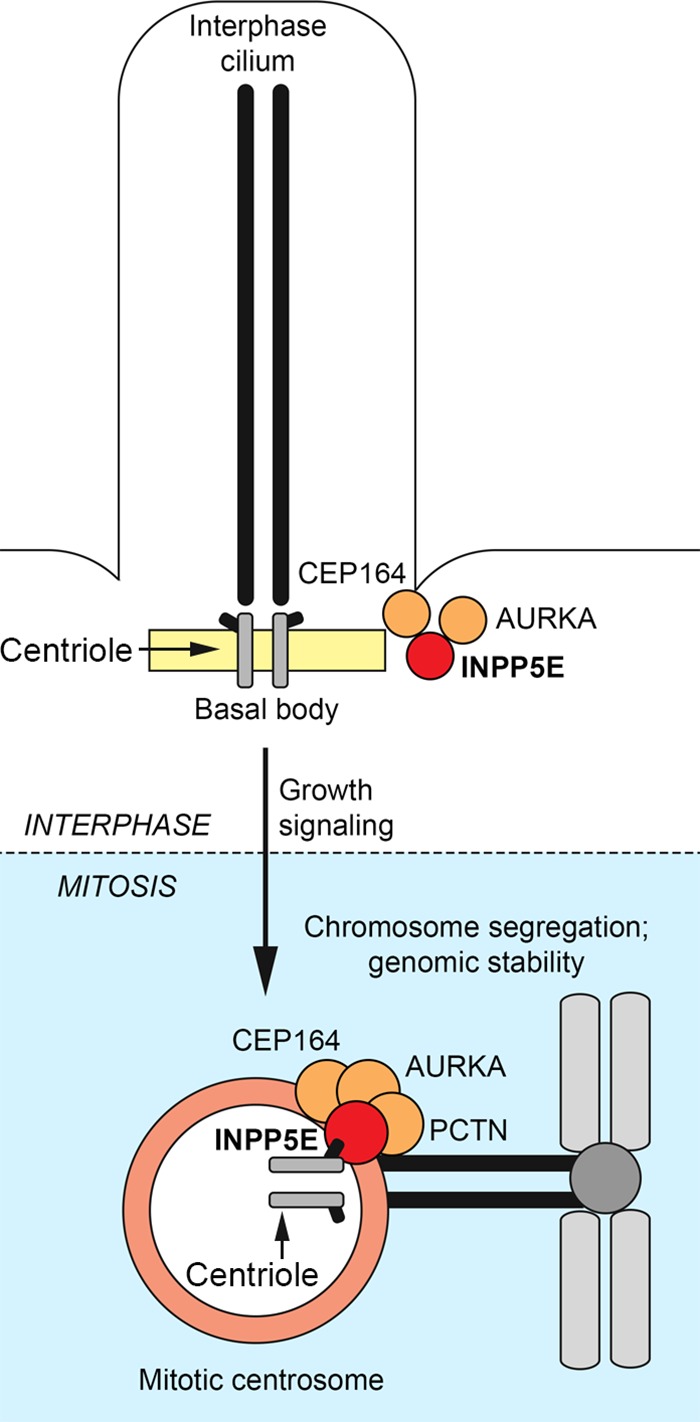
The partially understood phosphoinositide signaling cascade regulates multiple aspects of cellular metabolism. Previous studies revealed that INPP5E, the inositol polyphosphate-5-phosphatase that is mutated in the developmental disorders Joubert and MORM syndromes, is essential for the function of the primary cilium and maintenance of phosphoinositide balance in nondividing cells. Here, we report that INPP5E further contributes to cellular homeostasis by regulating cell division. We found that silencing or genetic knockout of INPP5E in human and murine cells impairs the spindle assembly checkpoint, centrosome and spindle function, and maintenance of chromosomal integrity. Consistent with a cell cycle regulatory role, we found that INPP5E expression is cell cycle dependent, peaking at mitotic entry. INPP5E localizes to centrosomes, chromosomes, and kinetochores in early mitosis and shuttles to the midzone spindle at mitotic exit. Our findings identify the previously unknown, essential role of INPP5E in mitosis and prevention of aneuploidy, providing a new perspective on the function of this phosphoinositide phosphatase in health and development.

Keywords: INPP5E; aneuploidy; cell cycle; centrosomes; mitosis; spindle assembly checkpoint.


Figures

FIG 1
FIG 1
Phosphoinositide phosphatases that control mitosis. The complex network of phosphoinositide phosphatases and kinases that together regulate cell cycle progression and prevent human disease has been reviewed in detail elsewhere (see the text for references). Three phosphoinositide phosphatases (PTEN, INPP5E, and SAC1) are shown here in the context of the simplified phosphoinositide (PIP) signaling network, showing relevant primary phosphatase substrates. PTEN is an established tumor suppressor that controls chromosome segregation and negatively controls the mitogen-activated protein kinase (MAPK) signaling network. Inherited PTEN mutations occur in a variety of cancer predisposition/central nervous system (CNS) malformation syndromes with partially overlapping clinical phenotypes, including Cowden syndrome and Bannayan-Riley-Ruvalcaba syndrome. Congenital OCRL mutations are found in Lowe syndrome associated with ocular abnormalities, mental retardation, and renal dysfunction. The OCRL phosphatase performs multiple cellular functions, including control of mitotic exit by processing midbody-associated PIPs to locally reorganize the midbody cytoskeleton at abscission. Germ line INPP5E mutations contribute to Joubert/MORM ciliopathy syndromes in humans and cause severe perinatal lethality in mice, while acquired mutations within INPP5E (green) occur in a variety of cancers. The SAC1 phosphatase controls mitotic spindle assembly and function, and disruption of SacI causes embryonic lethality in mice. While the mechanistic role of these phosphoinositide phosphatases in PIP metabolism and regulation of cellular homeostasis needs to be dissected in detailed in future studies, the clinical phenotypes of INPP5E-, PTEN-, and OCRL-deficient humans highlight the essential role of these cell cycle-regulating PIP phosphatases in preventing developmental malformations and cancers.
FIG 2
FIG 2
INPP5E regulates the spindle assembly checkpoint. (A) Assay schematic. Deficient SAC promotes multinucleation in paclitaxel-exposed cells. (B) Multinucleation due to impaired SAC in INPP5E and MAD2 knockdown cells exposed to paclitaxel. Note prometaphase arrest (active SAC) in control cells (condensed chromosomes in round mitotic cells). (C) Target knockout confirmed by Western blotting. (D and E) Quantification of multinucleation and mitotic arrest, respectively. One-way analysis of variance (ANOVA) was used to calculate P values (n ≥ 4 counts/siRNA). **, P < 0.01; ***, P < 0.001; ****, P < 0.0001.
FIG 3
FIG 3
Stable INPP5E knockdown weakens the SAC in HeLa cells and primary human fibroblasts. (A) INPP5E levels in cell lines stably expressing the indicated shRNAs. (B) Accumulation of an INPP5E substrate, PI(4,5)P2, in INPP5E knockdown HeLa cells. (C) Representative images of the indicated cell lines treated with paclitaxel for 22 h. Note multinucleation reflecting a weakened SAC in INPP5E-deficient HeLa cells and fibroblasts. (D) Quantification of SAC assay results. (E) Representative time-lapse images of Inpp5eflox/flox MEFs transduced with negative-control GFP lentivirus (top panel) and GFP-Cre recombinase (bottom panel) following paclitaxel exposure. Note accelerated SAC escape in the Inpp5eflox/flox cell. (F) Quantification of the length of time between NEB and SAC escape. The P value was calculated with an unpaired t test. For both cell types, n = 30 (two pooled experiments). (G) Western blot of whole-cell lysates from Inpp5eflox/flox MEFs transduced with lentivirus encoding GFP control or GFP-fused Cre recombinase.
FIG 4
FIG 4
Excess PI(4,5)P2 impairs the SAC. (A) Assay schematic. Prolonged SAC arrest triggers cell death unless checkpoint escape occurs. (B) Representative time-lapse images of cells treated with paclitaxel alone versus paclitaxel plus PI(4,5)P2. (C) Cells treated with paclitaxel plus PI(4,5)P2 are less likely to die and more likely to escape SAC upon prolonged arrest within 24 h of mitotic entry than cells treated with paclitaxel alone (n = 100 arrested cells tracked via time-lapse imaging per condition; P values were calculated with Fisher's exact test). Percentages of categorical values are shown. (D) Cumulative incidence of SAC escape in cells treated with paclitaxel plus DMSO versus paclitaxel plus PI(4,5)P2. The P value for risk of SAC escape was calculated with the log rank Mantel-Cox test. (E) Representative images of HeLa cells stably expressing shRNA against INPP5E stained with a PI(4,5)P2-specific antibody after a 24-hour exposure to DMSO (top) or the PIP5K1C/PIP4K2C inhibitor UNC3230 (100 nM) (bottom). Note decreased nuclear PI(4,5)P2 in UNC3230-treated cells. (F) Cumulative incidence of SAC escape in stable INPP5E knockdown HeLa cells treated with paclitaxel plus DMSO versus paclitaxel plus UNC3230. The P value for risk of SAC escape was calculated with the log rank Mantel-Cox test. For DMSO- and UNC3230-treated cells, n = 53 and 60, respectively.
FIG 5
FIG 5
INPP5E controls unperturbed mitosis. (A) Representative time-lapse imaging of a control cell progressing through mitosis. (B)Cumulative percentage of anaphase onset after NEB. P values were calculated with Fisher's exact test. (C) Fraction of anaphase cells 20 min after NEB (P = 0.0078 by Fisher's exact test; percentages of categorical values are shown). (D) Silencing INPP5E accelerates progression from NEB to anaphase. The P value was calculated with an unpaired t test (n = 50 control cells and 51 INPP5E knockdown cells). (E) Knockdown of INPP5E increases frequency of multipolar divisions and asymmetric mitotic exit in HeLa cells examined via time-lapse video microscopy compared to cells expressing nontargeting shRNA. P values were calculated with Fisher's exact test for multipolar divisions and with the chi-square test with Yates' correction for asymmetric mitotic exit. At least 500 dividing cells were quantified per genotype and condition. (F) Anaphase spindle elongation assay design. Cells were monitored through mitosis via time-lapse imaging, and the ratio of anaphase B length to metaphase length was determined for each cell to quantify the efficiency of anaphase spindle elongation similarly to previously described assays (63, 64). (G) Knockdown of INPP5E decreases anaphase spindle elongation in HeLa cells (dot plot, P < 0.0001 in two-tailed t test, n = 117 control cells and 132 INPP5E shRNA cells) and increases the frequency of cytokinesis failure (red dots, P < 0.0001 in Fisher's exact test) in HeLa INPP5E knockdown cells compared to cells transfected with negative-control siRNA. Each dot represents a single cell. (H) INPP5E-deficient cells undergo abnormal mitosis more frequently than control cells. (I) Examples of abnormal mitotic figures in INPP5E knockdown cells compared to controls. P values for early mitosis (prophase through metaphase) and late mitosis (anaphase through cytokinesis) are shown.
FIG 6
FIG 6
INPP5E protein expression is cell cycle dependent. (A and B) Serum starvation-induced G1 arrest in HCT cells. (C) Decreased endogenous INPP5E in HCT cells arrested in G1 via serum starvation. (D) Quantification of infrared Western blotting results shown in panel C. P values were calculated via ANOVA with Sidak's multiple-comparison test (3 replicates). (E) Representative cell cycle flow cytometry profiles of cells at the indicated time points after release from starvation-induced G1 arrest. (F) INPP5E accumulates as cells progress through the cell cycle. (G) Quantification of INPP5E protein levels at the indicated time points. P values for INPP5E were determined using unpaired t tests (n = 3 replicates). (H) Western blots of HeLa cell lysates released from RO3306-induced G2 arrest at the indicated time points. (I) Quantification of INPP5E and cyclin B1 protein (normalized to actin, n = 3 replicates) at the indicated time points. P values were calculated by one-way ANOVA.
FIG 7
FIG 7
Nuclear localization of INPP5E in interphase and mitosis. (A and B) Representative images of soluble (A) and insoluble (B) fractions of endogenous INPP5E in interphase and mitosis. Note that detergent extraction removes most of the soluble endogenous INPP5E after nuclear envelope breakdown in late prophase. Insoluble INPP5E returns to nucleus upon nuclear envelope reassembly in telophase. Images are representative of a total of least 30 cells across three separate experiments. (C) Decreased nuclear INPP5E immunofluorescence signal upon shRNA-mediated INPP5E knockdown. (D) Validation of endogenous INPP5E nuclear localization via another anti-INPP5E primary antibody. (E) Stably overexpressed DDK-INPP5E localizes to the nucleus.
FIG 8
FIG 8
INPP5E localizes to mitotic structures. (A) The insoluble fraction of endogenous INPP5E associates with mitotic centrosomes as demonstrated by colocalization with Aurora kinase A proximal to centrosome-microtubule attachment sites (immunofluorescence line intensity profiles shown as insert). (B) Coimmunofluorescence with Polo-like kinase PLK1 validates localization of endogenous INPP5E to mitotic centrosomes. (C) A fraction of extraction-resistant endogenous INPP5E binds prometaphase kinetochores, as demonstrated by coimmunofluorescence with the kinetochore markers NUP85 and CENPA. Note that INPP5E kinetochore localization is cell cycle dependent and decreases after anaphase entry. (D) Endogenous INPP5E is enriched around the metaphase and anaphase spindle as demonstrated by coimmunofluorescence with alpha-tubulin and PLK1, respectively. Immunofluorescence line intensity profiles are shown. (E). INPP5E shuttles to the midbody during telophase. Alpha-tubulin was used as a midbody marker to demonstrate localization of endogenous INPP5E (left) and GFP-INPP5E (right). Three-dimensional midbody models were generated in Imaris. HeLa cells were used for all images shown. Images are representative of at least 3 cells per cell cycle phase from two experiments.
FIG 9
FIG 9
Phosphoinositides localize to mitotic centrosomes. (A) HeLa cells stained with a PI(4,5)P2-specific antibody and anti-phospho-Aurora to mark mitotic centrosomes. (B) Representative images of HeLa cells transiently expressing an RFP-fused construct of the PI(4,5)P2- and PI(3,4,5)P3-binding domain of phospholipase C (PLCδ-PH). Cells were costained with antipericentrin to mark centrosomes.
FIG 10
FIG 10
INPP5E regulates nucleation of spindle microtubules at mitotic centrosomes. (A) Assay schematic. (B) Cold spindle destabilization in control and INPP5E knockdown prometaphase cells. (C) Impaired microtubule spindle reassembly in a representative INPP5E knockdown cell compared to a control. (D and E) Quantification of the number of microtubules per centrosome (D) and the microtubule length (E). P values were calculated by two-tailed t tests (n = 14 centrosomes/170 microtubules for controls and 20 centrosomes/76 microtubules for INPP5E knockdown cells). (F) Representative image of prometaphase microtubule repolymerization in cold-treated cells following treatment with carrier only (top panel) or 20 μM PI(4,5)P2 (bottom panel). (G) Quantification of microtubule length. the P value was calculated with an unpaired t test. For control cells, n = 175; for PI(4,5)P2-treated cells, n = 76.
FIG 11
FIG 11
Loss of INPP5E causes genomic instability. (A and B) Chromosome instability in INPP5E-deficient cells. Representative metaphase chromosome spreads prepared from stable control and INPP5E shRNA-expressing primary human early-passage fibroblasts are shown. For quantification of abnormal karyotypes (B), the P value was calculated with the two-tailed Fisher's exact test (n = 50/genotype). (C) Design of cytochalasin B micronucleation assay. (D) Micronucleation assay quantification. P values were determined via the two-tailed Fisher's exact test (n = 12 counts/phenotype/genotype). Representative micronuclei are shown.
FIG 12
FIG 12
INPP5E controls cellular homeostasis by regulating cilia and centrosomes throughout the cell cycle. INPP5E regulates ciliary stability in interphase and controls mitotic apparatus during cell division. See the text for discussion.
FIG 13
FIG 13
Acquired INPP5E mutations in cancer. Note that most cancer-associated mutations cluster within the INPP5E phosphatase domain. Cancer types are indicated by colors of mutation-associated circles as shown. The results shown here are based upon data generated by the TCGA Research Network (http://cancergenome.nih.gov/).

References

    1. Santaguida S, Amon A. 2015. Short- and long-term effects of chromosome mis-segregation and aneuploidy. Nat Rev Mol Cell Biol 16:473–485. doi:10.1038/nrm4025. - DOI - PubMed
    1. London N, Biggins S. 2014. Signalling dynamics in the spindle checkpoint response. Nat Rev Mol Cell Biol 15:736–747. doi:10.1038/nrm3888. - DOI - PMC - PubMed
    1. Godek KM, Kabeche L, Compton DA. 2015. Regulation of kinetochore-microtubule attachments through homeostatic control during mitosis. Nat Rev Mol Cell Biol 16:57–64. doi:10.1038/nrm3916. - DOI - PMC - PubMed
    1. Nalepa G, Enzor R, Sun Z, Marchal C, Park SJ, Yang Y, Tedeschi L, Kelich S, Hanenberg H, Clapp DW. 2013. Fanconi anemia signaling network regulates the spindle assembly checkpoint. J Clin Invest 123:3839–3847. doi:10.1172/JCI67364. - DOI - PMC - PubMed
    1. Maffucci T. 2012. An introduction to phosphoinositides, p 1–42. In Falasca M. (ed), Phosphoinositides and disease. Springer Science+Business Media, Dordrecht, the Netherlands.

Publication types

Substances