. 2017 Feb 14;91(5):e02217-16.
doi: 10.1128/JVI.02217-16. Print 2017 Mar 1.

Binding of the Methyl Donor S-Adenosyl-l-Methionine to Middle East Respiratory Syndrome Coronavirus 2'- O-Methyltransferase nsp16 Promotes Recruitment of the Allosteric Activator nsp10

Affiliations

Binding of the Methyl Donor S-Adenosyl-l-Methionine to Middle East Respiratory Syndrome Coronavirus 2'- O-Methyltransferase nsp16 Promotes Recruitment of the Allosteric Activator nsp10

Wahiba Aouadi et al. J Virol. .

Abstract

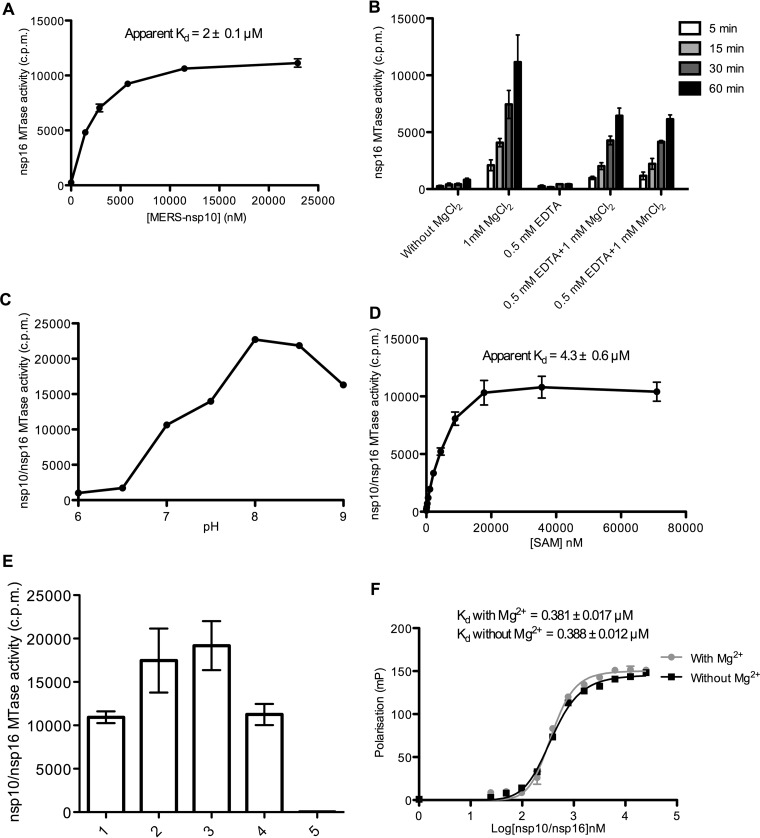
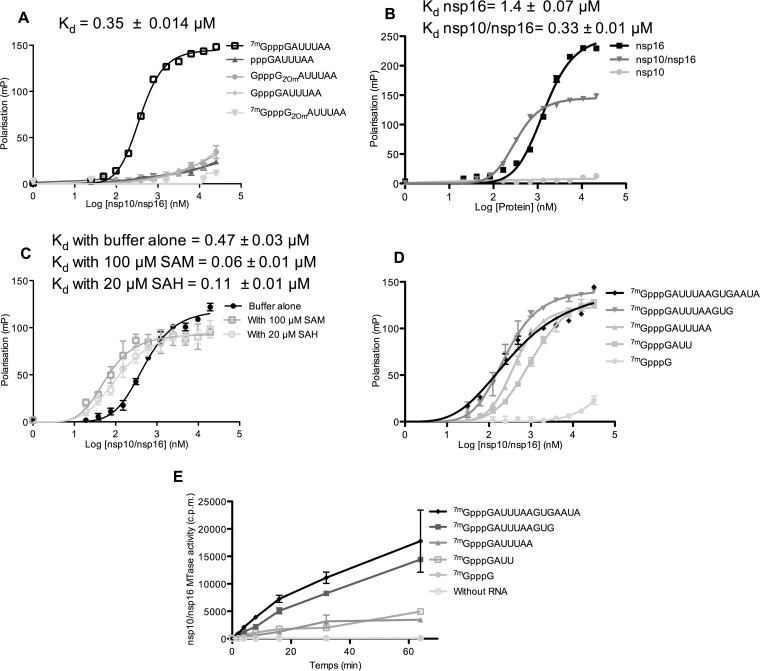
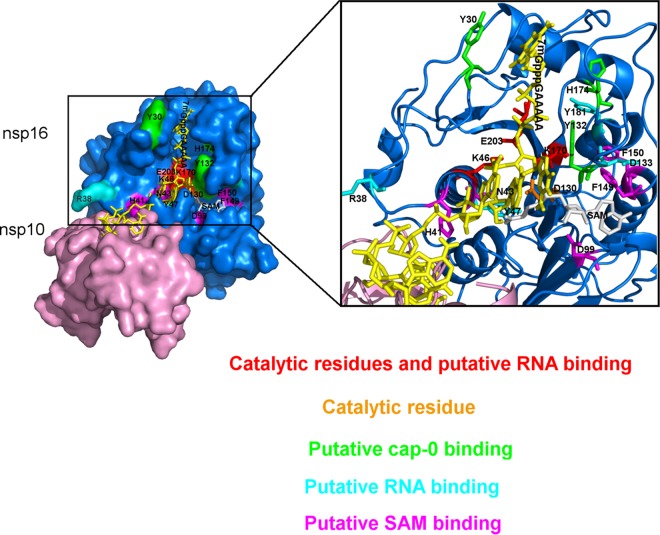
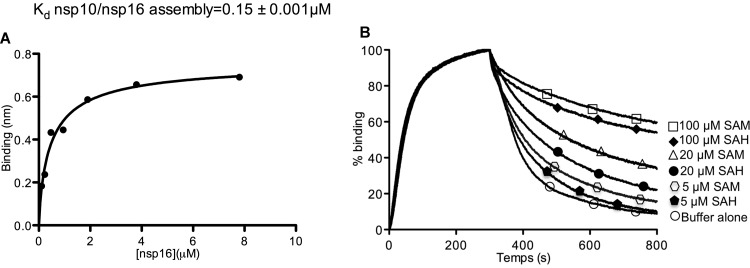
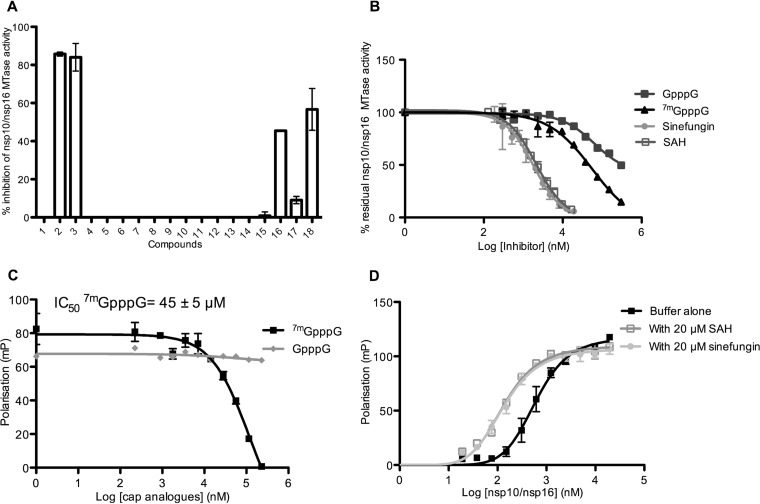
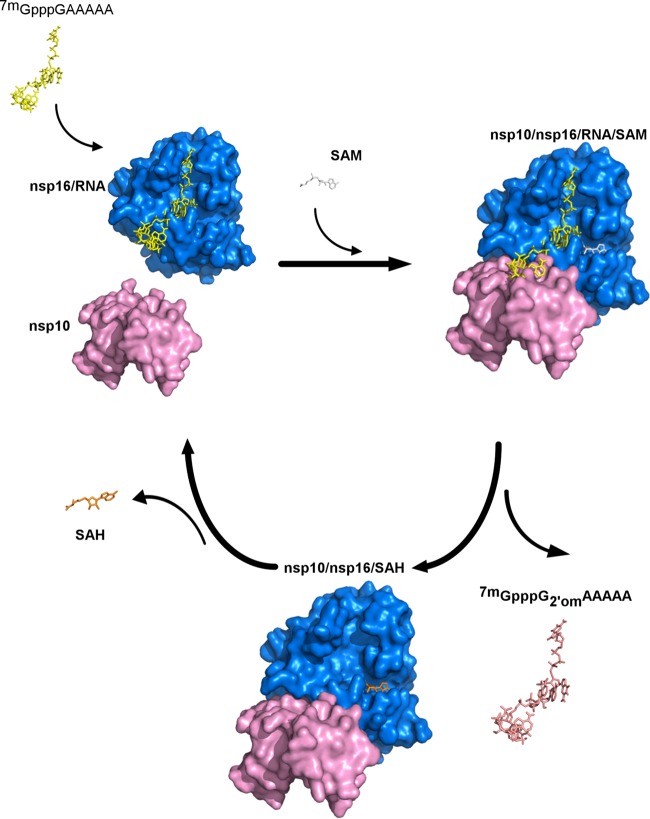
The Middle East respiratory syndrome coronavirus (MERS-CoV) nonstructural protein 16 (nsp16) is an S-adenosyl-l-methionine (SAM)-dependent 2'-O-methyltransferase (2'-O-MTase) that is thought to methylate the ribose 2'-OH of the first transcribed nucleotide (N1) of viral RNA cap structures. This 2'-O-MTase activity is regulated by nsp10. The 2'-O methylation prevents virus detection by cell innate immunity mechanisms and viral translation inhibition by the interferon-stimulated IFIT-1 protein. To unravel the regulation of nsp10/nsp16 2'-O-MTase activity, we used purified MERS-CoV nsp16 and nsp10. First, we showed that nsp16 recruited N7-methylated capped RNA and SAM. The SAM binding promotes the assembly of the enzymatically active nsp10/nsp16 complex that converted 7mGpppG (cap-0) into 7mGpppG2'Om (cap-1) RNA by 2'-OH methylation of N1 in a SAM-dependent manner. The subsequent release of SAH speeds up nsp10/nsp16 dissociation that stimulates the reaction turnover. Alanine mutagenesis and RNA binding assays allowed the identification of the nsp16 residues involved in RNA recognition forming the RNA binding groove (K46, K170, E203, D133, R38, Y47, and Y181) and the cap-0 binding site (Y30, Y132, and H174). Finally, we found that nsp10/nsp16 2'-O-MTase activity is sensitive to known MTase inhibitors, such as sinefungin and cap analogues. This characterization of the MERS-CoV 2'-O-MTase is a preliminary step toward the development of molecules to inhibit cap 2'-O methylation and to restore the host antiviral response. IMPORTANCE MERS-CoV codes for a cap 2'-O-methyltransferase that converts cap-0 into cap-1 structure in order to prevent virus detection by cell innate immunity mechanisms. We report the biochemical properties of MERS-CoV 2'O-methyltransferase, which is stimulated by nsp10 acting as an allosteric activator of the nsp16 2'-O-methyltransferase possibly through enhanced RNA binding affinity. In addition, we show that SAM promotes the formation of the active nsp10/nsp16 complex. Conversely, after cap methylation, the reaction turnover is speeded up by cap-1 RNA release and nsp10/nsp16 complex dissociation, at the low intracellular SAH concentration. These results suggest that SAM/SAH balance is a regulator of the 2'-O-methyltransferase activity and raises the possibility that SAH hydrolase inhibitors might interfere with CoV replication cycle. The enzymatic and RNA binding assays developed in this work were also used to identify nsp16 residues involved in cap-0 RNA recognition and to understand the action mode of known methyltransferase inhibitors.

Keywords: RNA processing; RNA virus; biochemistry.


Figures

FIG 1
FIG 1
MERS-CoV nsp16 2′-O-MTase activity is promoted by nsp10. Recombinant MERS-CoV nsp10, nsp16, and nsp10/nsp16 complex were expressed in E. coli and purified by affinity chromatography on IMAC columns. (A) After SDS-PAGE separation of purified proteins (0.2 μg), gels were stained with Coomassie blue. MW, molecular mass markers. (B) The nsp10/nsp16 complex was purified by gel filtration using a S200-16/60 column. The elution chromatogram (optical density, 280 nm) shows one main peak that eluted at 90 ml and corresponded to the nsp10/nsp16 complex. (C) The methyltransferase activities (MTase) of nsp16 (1.2 μM) and nsp10 (2 μM) alone or together and of the nsp10/nsp16 complex (1 μM) were determined by monitoring the transfer of 3H-CH3 from SAM to RNA oligonucleotides with sequences corresponding to the 5′ end of the MERS-CoV genome with various cap modifications (pppGAUUUAA, GpppGAUUUAA, 7mGpppGAUUUAA, GpppG2′omAUUUAA, and 7mGpppG2′omAUUUAA). Assays were stopped after 5, 30, 60, and 180 min, and the radioactivity associated with the RNA was determined by a DEAE-filter binding assay. The bar graph presents the means and standard deviations of three independent experiments.
FIG 2
FIG 2
Biochemical characterization of the MERS-CoV nsp10/nsp16 2′-O-MTase. The 2′-O-MTase activity of MERS-CoV nsp16 was characterized by filter binding assay as described in Fig. 1C. (A) nsp16 2′-O-MTase activity is promoted by nsp10. nsp16 (2 μM) was incubated with 7mGpppGAUUUAA (0.7 μM) in the presence of increasing concentrations of nsp10. The apparent Kd of the nsp10-nsp16 interaction (2 ± 0.1 μM; mean ± the standard error of the mean [SEM] of three independent experiments) was deduced by curve fitting using Hill slope equations. (B) Effect of divalent ions on nsp16 2′-O-MTase activity. MTase assays were performed in the presence or not of divalent ions (MgCl2). Inhibition of the MTase reaction by EDTA was assessed, and the activity was recovered by addition of MgCl2 or MnCl2. The methyl transfer was measured after 5, 15, 30, and 60 min at 30°C (mean ± the SD). (C) Optimum pH of the 2′-O-MTase activity mediated by nsp10/nsp16. (D) nsp10/nsp16 MTase activity in the presence of increasing concentrations of SAM. The apparent Kd of SAM (4.3 ± 0.6 μM) was deduced by curve fitting using a Hill equation and the GraphPad Prism program. (E) Measurement of nsp10/nsp16 MTase activity on cap-0 RNA sequences that correspond to the 5′-end of various viruses: (1) MERS-CoV (7mGpppGAUUUAAGUGAAUA), (2) West Nile virus (7mGpppAGUAGUUCGCCUG), (3) dengue virus (7mGpppAGUUGUUAGUCUA), (4) Ebola virus (7mGpppGAUGAAGAUUAAG) after 30 min of incubation at 30°C (n = 3, mean ± SEM), and (5) without RNA. (F) Magnesium ions do not influence nsp10-nsp16 interaction with cap-0 RNA. 7mGpppGAUUUAA-cy5 was incubated with increasing concentrations of the nsp10/nsp16 complex with or without 1 mM MgCl2. The interaction with the cy5-labeled RNA was followed by fluorescent polarization, and the apparent calculated Kd values are indicated at the top of the graph.
FIG 3
FIG 3
RNA binding properties of MERS-CoV nsp10, nsp16, and the nsp10/nsp16 complex. (A) nsp10/nsp16 recognizes cap-0 RNA. Different short RNA oligonucleotides (pppGAUUUAA, GpppGAUUUAA, 7mGpppGAUUUAA, GpppG2′omAUUUAA, or 7mGpppG2′omAUUUAA) corresponding to the 5′ end of the MERS-CoV genome were 3′ end labeled with pCp-cy5 and incubated with increasing concentrations of nsp10/nsp16 complex. The interaction between the nsp10/nsp16 complex and each RNA was monitored by measuring the fluorescence polarization signal at 675 nm. The apparent affinity constant (Kd) was calculated by nonlinear regression analysis with a Hill slope equation and is indicated at the top of the graph. (B) nsp16 and the nsp10/nsp16 complex recognize cap-0 RNA. 7mGpppGAUUUAA-cy5 was incubated with increasing concentrations of nsp10, nsp16, or nsp10/nsp16 complex. The interaction with cy5-labeled RNA was monitored by measuring the fluorescence polarization, as described in panel A, and the calculated Kd is indicated at the top of the graph. (C) SAM and SAH enhance the interaction of the nsp10/nsp16 complex with cap-0 RNA. 7mGpppGAUUUAA-cy5 was incubated with increasing concentrations of nsp10/nsp16 complex in the presence or not (buffer alone) of 100 μM SAM or 20 μM SAH. The interaction with cy5-labeled RNAs was monitored by measuring the fluorescence polarization, and the calculated Kd is indicated at the top of the graph. (D) RNA length effect on nsp10/nsp16 binding was analyzed using viral native 7mGppp RNAs of different lengths (7mGpppG, 7mGpppGAUU, 7mGpppGAUUUAA, 7mGpppGAUUUAAGUG, and 7mGpppGAUUUAAGUGAAUA) in the presence of increasing concentrations of nsp10/nsp16. The interaction with cy5-labeled RNAs was monitored by fluorescence polarization, and the calculated Kd values are indicated in Table 1. (E) Kinetics of MTase activity of the nsp10/nsp16 complex (0.25 μM) on 7mGpppG-RNAs (0.7 μM) of increasing length was measured by filter binding assay after 2, 4, 8, 16, 32, and 64 min of incubation at 30°C in the presence of 3H-SAM. The curve presents the means and standard errors of the means for three independent experiments. All the fluorescent polarization experiments were performed twice independently, and the Kd values of each condition were calculated using GraphPad Prism (n = 2, mean ± the SEM) using one site-specific binding equation with the Hill slope.
FIG 4
FIG 4
3D structural model of the nsp10/nsp16 complex interaction with 7mGppp-RNA. The nsp10/nsp16 model was built by alignment of SARS-CoV (PDB entry 3R24) and MERS-CoV nsp10/nsp16 sequences using the Swiss model and the PyMOL software. The cap-0 RNA/nsp16 model was built by aligning the MERS-CoV nsp16 sequence with that of the vaccinia virus MTase VP39 (PDB entry 1AV6) using the PyMOL software. The surface of nsp16 residues is indicated in blue, and that of nsp10 is indicated in pink. The nsp16 catalytic residue D130 is depicted in orange, while the catalytic and putative RNA binding residues K46, K170, and E203 are depicted in red. The putative cap-0 RNA binding site (light green) is delimited by Y30 and Y132, which are localized in the two mobile α helices (26-38 and 130-148, respectively), and by H174 close to the last helix. The residues of the putative RNA binding groove are indicated in cyan (Y181, D133, Y47, and R38). The SAM binding pocket involves the residues N43, D99, F149, F150, and H41 (magenta); SAM is indicated in gray, and cap-0 RNA is indicated in yellow. The zoom enlargement focuses on the RNA binding groove and the SAM binding domain (ribbon structure).
FIG 5
FIG 5
MERS-CoV nsp16 mutations that affect RNA recognition and/or MTase activity. (A) Alanine scanning mutagenesis. Mutations were introduced in the nsp16 clone and, after colysis, the nsp10/nsp16 complex was purified by affinity chromatography on IMAC. The affinity (Ka = 1/Kd) of each mutant protein for 7mGpppGAUUUAA-cy5 was measured by fluorescence polarization as described in Fig. 3. The affinity (Ka = 1/Kd) of each mutant protein for 7mGpppGAUUUAA-cy5 was measured by fluorescence polarization as described for Ka in Fig. 3. The Ka values were estimated from the Hill equation using GraphPad Prism (n = 2, mean ± SEM). The Ka values were only estimated for the mutants indicated by an asterisk because the RNA binding plateau was not reached in the fluorescence polarization experiment. (B) The MTase activity of each mutant (1 μM) was determined after incubation with 7mGpppGAUUUAA at 30°C in the presence of 3H-SAM for 60 min. The bar graph presents the mean and the standard deviation for three independent experiments.
FIG 6
FIG 6
SAM and SAH modulate nsp10-nsp16 interaction. (A) nsp10/nsp16 steady-state assembly: real-time nsp16 binding to biotinylated nsp10 was measured by Octet biolayer interferometry. Streptavidin biosensors coated with 100 nM biotinylated nsp10 were used to measure nsp16 (0 to 7.8 μM) association and dissociation. The reference sensor (0 μM nsp16) values were subtracted from the sample traces. All curves were fitted with a 1:1 model by using the Octet biolayer program, and then the steady-state curve was traced using the site-specific binding equation on GraphPad Prism. The different Kd values of the nsp10-nsp16 interaction in the presence or not of 100 μM SAM or 20 or 100 μM SAH are presented in Table 2. (B) Effects of SAM and SAH on the dissociation kinetics of nsp16 from immobilized nsp10. A 7.8 μM concentration of nsp16 was bound to sensor-immobilized biotinylated nsp10 in the presence of 100 μM SAM. The sensor was then moved to dissociation buffer alone or containing 5, 20, or 100 μM SAM or SAH. nsp16 binding to immobilized nsp10 was normalized for each trace.
FIG 7
FIG 7
Inhibition of nsp10/nsp16 complex MTase activity and RNA binding. (A) Bar graph showing the MTase inhibition activity (percentage) of each candidate inhibitor (final concentration, 50 μM). An MTase assay was performed as in Fig. 1C by incubating 0.5 μM nsp10/nsp16 complex with 0.7 μM 7mGpppGAUUUAA and 3H-SAM at 30°C for 30 min. The methyl transfer to RNA was measured by a filter binding assay in the absence (5% DMSO) or presence of each inhibitor (n = 2, mean ± the SD): 1, DMSO; 2, sinefungin; 3, SAH; 4, SIBA; 5, ribavirin; 6, ribavirin-TP; 7, N-(5-chloro-2-methoxyphenyl)-3,4-dimethoxy-N-[2-(4-methyl-1-piperazinyl)-2-oxoethyl]benzenesulfonamide; 8, 2-[[4-benzyl-5-(3-pyridinyl)-4H-1,2,4-triazol-3-yl]thiol]-N-(5-methyl-1,3,4-thiadiazol-2-yl) acetamide; 9, N-1-cyclopropyl-N-2-(2,5-dimethoxyphenyl)-N-2-(methylsulfonyl) glycinamide; 10, 4-bromophenyl 3-(3,5-dioxo-4-azatetracyclo [5.3.2.0-2,6-0.0-8,10-] dodec-11-en-4-yl) propanoate; 11, 1′-[(4-tert-butylphenyl)sulfonyl]-1,4′-bipiperidine-4′-carboamide; 12, N′-(3,4-dichlorobenzylidene)-2-(2-pyridinylthio) acetohydrazide; 13, GTP; 14, 7mGTP; 15, GpppA; 16, 7mGpppA; 17, GpppG; and 18, 7mGpppG. (B) Dose response of the inhibitory effect of sinefungin, SAH, and cap analogues on nsp10/nsp16 MTase activity (MTase assays were performed as described for panel A [n = 2, mean ± the SEM]). The IC50s deduced by using GraphPad Prism and the log (inhibitor) versus response variable slope equation are shown in Table 3. (C) The competition effect of cap analogues on 7mGpppGAUUUAA-cy5 binding to the nsp10/nsp16 complex was analyzed by fluorescence polarization, as described for Fig. 3. Measurements were performed in the presence of increasing concentrations of cap analogues. (D) The effect of 20 μM SAH, 20 μM sinefungin, or buffer alone on the nsp10/nsp16 complex interaction with 7mGpppGAUUUAA-cy5 was assessed by fluorescence polarization, as described in Fig. 3C. The Kd values deduced from the curve fitting are given in Results (n = 2, mean ± the SEM).
FIG 8
FIG 8
Model of the nsp10/nsp16-7mGpppRNA reaction turnover regulated by the SAM/SAH balance. The nsp10/nsp16 model was built as described previously in Fig. 4. The three-dimensional representation of nsp16 structure is indicated in blue, 7mGpppGAAAAA is indicated in yellow, and nsp10 is indicated in pink. According to our model, nsp16 first binds to cap-0 RNA and then loads a SAM molecule (gray, 100 μM in infected cells), thus allowing the recruitment of the nsp10 allosteric activator. The nsp16 then catalyzes cap RNA methylation and converts cap-0 into cap-1 RNA (indicated in salmon). Methylated RNA is released from the nsp16 cap-binding site. Since SAH (indicated in orange) is supposed to be at lower concentration than SAM in infected cells (20 μM versus 100 μM), SAH would be released from the nsp10/nsp16 complex, and this should favor its dissociation and reaction turnover.

Similar articles

Cited by

References

    1. Zaki AM, van Boheemen S, Bestebroer TM, Osterhaus ADME, Fouchier RAM. 2012. Isolation of a novel coronavirus from a man with pneumonia in Saudi Arabia. N Engl J Med 367:1814–1820. doi:10.1056/NEJMoa1211721. - DOI - PubMed
    1. de Wit E, van Doremalen N, Falzarano D, Munster VJ. 2016. SARS and MERS: recent insights into emerging coronaviruses. Nat Rev Microbiol 14:523–534. doi:10.1038/nrmicro.2016.81. - DOI - PMC - PubMed
    1. Arabi YM, Harthi A, Hussein J, Bouchama A, Johani S, Hajeer AH, Saeed BT, Wahbi A, Saedy A, Al Dabbagh T, Okaili R, Sadat M, Balkhy H. 2015. Severe neurologic syndrome associated with Middle East respiratory syndrome coronavirus (MERS-CoV). Infection 43:495–501. doi:10.1007/s15010-015-0720-y. - DOI - PMC - PubMed
    1. Chan JF, Lau SK, To KK, Cheng VC, Woo PC, Yuen KY. 2015. Middle East respiratory syndrome coronavirus: another zoonotic betacoronavirus causing SARS-like disease. Clin Microbiol Rev 28:465–522. doi:10.1128/CMR.00102-14. - DOI - PMC - PubMed
    1. Durai P, Batool M, Shah M, Choi S. 2015. Middle East respiratory syndrome coronavirus: transmission, virology, and therapeutic targeting to aid in outbreak control. Exp Mol Med 47:e181. doi:10.1038/emm.2015.76. - DOI - PMC - PubMed

Publication types

MeSH terms

LinkOut - more resources