. 2017 Mar 17;45(5):2341-2353.
doi: 10.1093/nar/gkw1321.

High-throughput identification of C/D box snoRNA targets with CLIP and RiboMeth-seq

Affiliations

High-throughput identification of C/D box snoRNA targets with CLIP and RiboMeth-seq

Rafal Gumienny et al. Nucleic Acids Res. .

Abstract

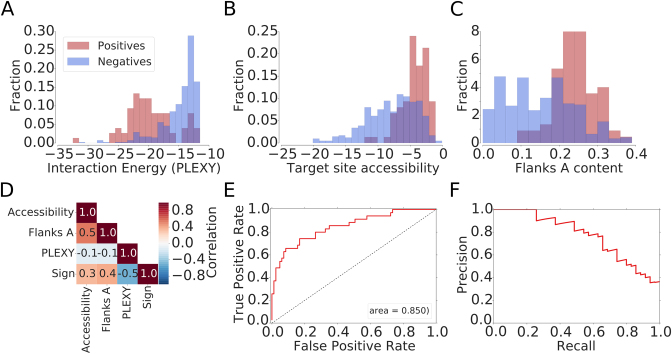
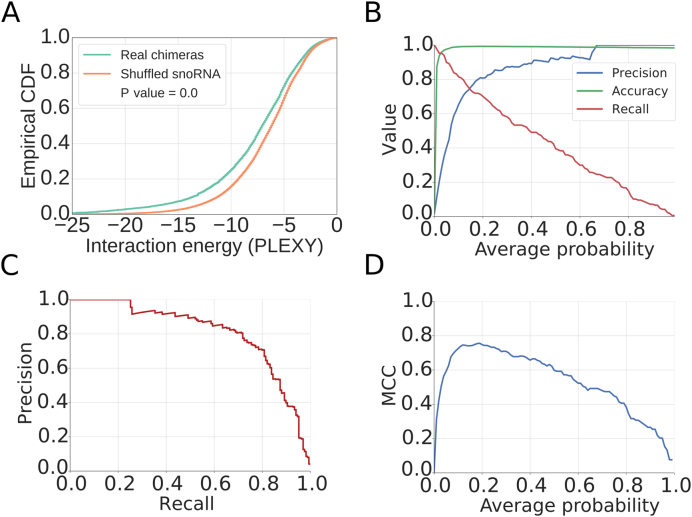
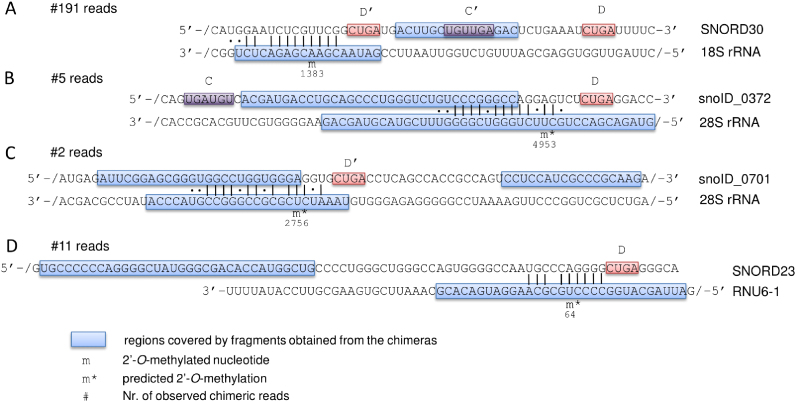
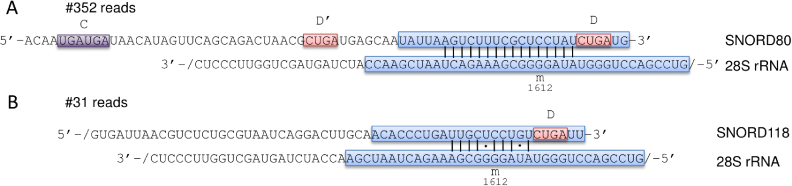
High-throughput sequencing has greatly facilitated the discovery of long and short non-coding RNAs (ncRNAs), which frequently guide ribonucleoprotein complexes to RNA targets, to modulate their metabolism and expression. However, for many ncRNAs, the targets remain to be discovered. In this study, we developed computational methods to map C/D box snoRNA target sites using data from core small nucleolar ribonucleoprotein crosslinking and immunoprecipitation and from transcriptome-wide mapping of 2΄-O-ribose methylation sites. We thereby assigned the snoRNA guide to a known methylation site in the 18S rRNA, we uncovered a novel partially methylated site in the 28S ribosomal RNA, and we captured a site in the 28S rRNA in interaction with multiple snoRNAs. Although we also captured mRNAs in interaction with snoRNAs, we did not detect 2΄-O-methylation of these targets. Our study provides an integrated approach to the comprehensive characterization of 2΄-O-methylation targets of snoRNAs in species beyond those in which these interactions have been traditionally studied and contributes to the rapidly developing field of 'epitranscriptomics'.


Figures

Figure 1.
Figure 1.
Features that are relevant for the identification snoRNA–target interactions based on chimeric reads. Distributions of (A) the interaction energy calculated with PLEXY (28), (B) the target site accessibility calculated with CONTRAfold (51) and (C) the A nucleotide composition of the neighborhood of positive (known) and negative (captured in chimeras but unknown) snoRNA interaction sites. (D) Correlation between features used for model training and the indicator function, taking the value of −1 for negative and 1 for positive sites. (E) Receiver operating characteristic (ROC) curve and (F) Precision-Recall (PR) curve constructed based on snoRNA target predictions in 18S rRNA with the model trained on 28S rRNA target sites.
Figure 2.
Figure 2.
Characterization of the model for inferring snoRNA–target interactions from chimeric reads. (A) Empirical cumulative distribution function of the interaction energy estimated with PLEXY between target fragment and snoRNA found in the chimera ('Real chimeras') or between target fragment and a randomly assigned snoRNA ('Shuffled snoRNA'). P-value from the Mann–Whitney U test is also shown. (B) Metrics illustrating the performance of the method, as a function of the minimum average probability of the considered sites from the 18S and 28S rRNAs. (C) Precision-Recall curve for the method. (D) Matthews correlation coefficient (MCC) as a function of the minimum average probability of the considered sites.
Figure 3.
Figure 3.
Schematic representation of snoRNA–target interactions that are predicted based on chimeric reads from CLIP experiments. For each interaction, the snoRNA sequence is shown at the top and the target sequence at the bottom of the panel. ‘/’ indicates that only part of the sequence is shown, for readability. Regions of both snoRNAs and targets that are represented in the chimeric reads are encompassed in blue boxes. Indicated are also the presumed C/C’ and D/D’ boxes as well as the number of chimeric reads supporting each of the interactions. PLEXY-predicted sites of 2΄-O-methylation are marked by ‘m*’ and the previously mapped site is labeled with ‘m’.
Figure 4.
Figure 4.
Similar to Figure 3, representation of the data supporting the interaction of both SNORD80 and SNORD118 with the 28S rRNA, around the known position of 2΄-O-methylation at G1612.
Figure 5.
Figure 5.
Analysis of RiboMeth-seq data. (A) Strategy for evaluating the RiboMeth-seq data. The score was calculated based on the normalized log2 coverage of a position and of its immediately adjacent neighbors by RiboMeth-seq reads. A large score indicates stronger depletion of the position by 3/5΄ ends of reads and thus resistance to alkaline hydrolysis. (B) Example of a normalized log2 coverage profile along 28S rRNA and calculated scores (Angle and Score A). With red dashed lines positions of known 2΄-O-methylation sites are indicated. The red rectangles indicates regions where no 2΄-O-methylation has been mapped, which is also predicted by the angle score but not by score A. (C) Example of Precision-Recall curves obtained for the two scoring methods applied to rRNAs from the RiboMethSeq_HEK_totalRNA_8min experiment. (D) Matthews correlation coefficient (MCC) plot of average RiboMeth-seq score indicating the optimal angle score.
Figure 6.
Figure 6.
Location of snoRNA interaction sites and 2΄-O-ribose methylation in the (A) 18S and (B) 28S ribosomal subunits. 2΄-O-Me positions that are known from literature are shown as black bars. Interaction sites identified from chimeric reads are shown as blue bars, with their associated probabilities. The gray area indicates the score threshold that we used to extract the high-confidence sites from chimeric reads. The locations of 2΄-O-Me sites identified with RiboMeth-seq are shown with red lines and dots.
Figure 7.
Figure 7.
SNORD2-guided 2΄-O-methylation of G2435 in the 28S rRNA (A) Schematic representation of the predicted interaction, which is supported by 28 chimeric reads (see also legend of Figure 3). (B) Confirmation of the G2435 2΄-O-methylation by RTL-P followed by agarose gel analysis and followed by qPCR analysis. Error bars represent the standard deviation of the mean, and the P -value of the t-test computed over three replicate experiments, each with three technical replicates is indicated. (C) Targeted LC-MS/MS analysis of UCCUG*, confirming the 2΄-O-methylation at G2435. A synthetic RNA oligonucleotide control (on top) and fragment A2416-G2461 from 28S rRNA (at the bottom) were digested with RNase T1 and specific transitions measured by targeted mass spectrometry.

Similar articles

Cited by

References

    1. Li S., Mason C.E.. The pivotal regulatory landscape of RNA modifications. Annu. Rev. Genomics Hum. Genet. 2014; 15:127–150. - PubMed
    1. Birkedal U., Christensen-Dalsgaard M., Krogh N., Sabarinathan R., Gorodkin J., Nielsen H.. Profiling of ribose methylations in RNA by high-throughput sequencing. Angew. Chem. Int. Ed. Engl. 2014; 10.1002/anie.201408362. - PubMed
    1. Dominissini D., Moshitch-Moshkovitz S., Schwartz S., Salmon-Divon M., Ungar L., Osenberg S., Cesarkas K., Jacob-Hirsch J., Amariglio N., Kupiec M. et al. . Topology of the human and mouse m6A RNA methylomes revealed by m6A-seq. Nature. 2012; 485:201–206. - PubMed
    1. Schwartz S., Bernstein D.A., Mumbach M.R., Jovanovic M., Herbst R.H., León-Ricardo B.X., Engreitz J.M., Guttman M., Satija R., Lander E.S. et al. . Transcriptome-wide mapping reveals widespread dynamic-regulated pseudouridylation of ncRNA and mRNA. Cell. 2014; 159:148–162. - PMC - PubMed
    1. Schaefer M. RNA 5-methylcytosine analysis by bisulfite sequencing. Methods Enzymol. 2015; 560:297–329. - PubMed

Publication types

MeSH terms