. 2017 Mar 1;117(3):1266-1280.
doi: 10.1152/jn.00462.2016. Epub 2016 Dec 28.

Principles of auditory processing differ between sensory and premotor structures of the songbird forebrain

Affiliations

Principles of auditory processing differ between sensory and premotor structures of the songbird forebrain

Efe Soyman et al. J Neurophysiol. .

Abstract

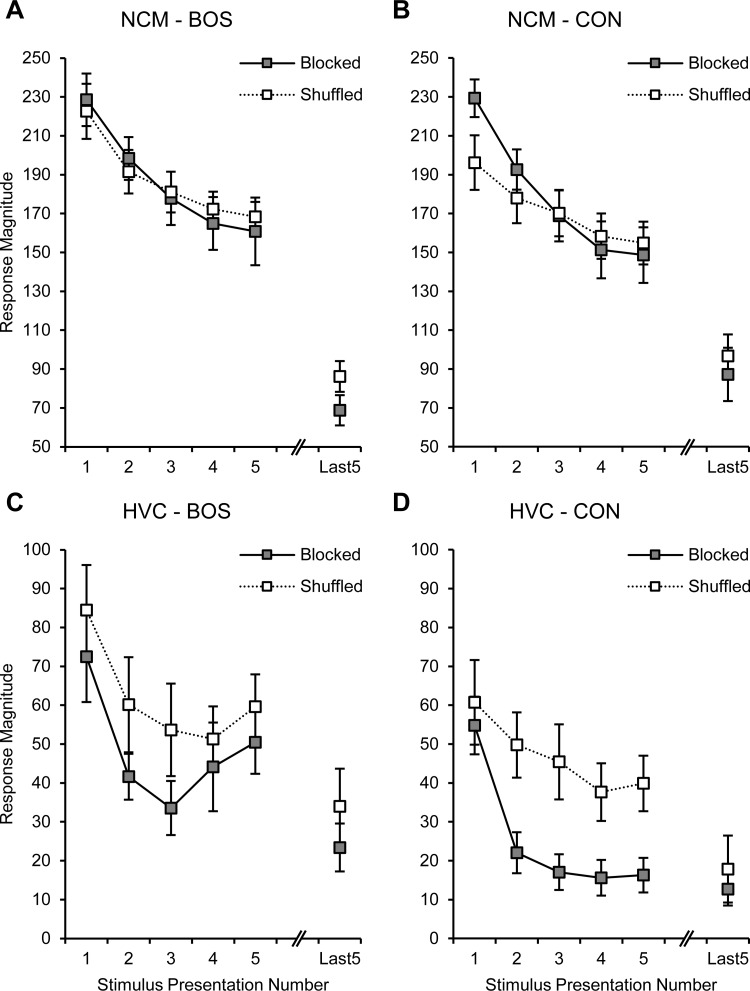
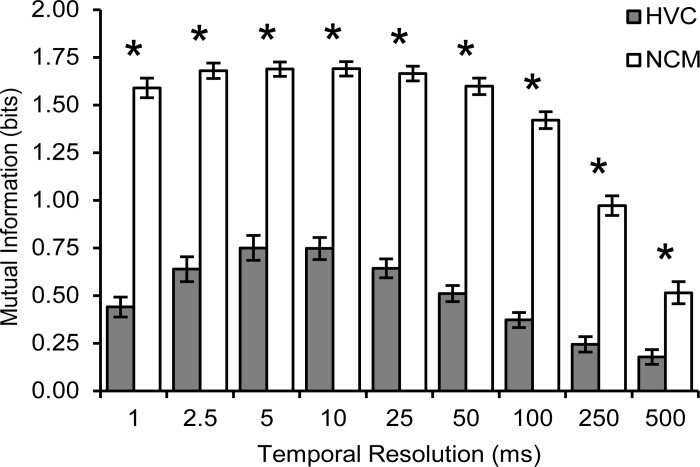
Sensory and motor brain structures work in collaboration during perception. To evaluate their respective contributions, the present study recorded neural responses to auditory stimulation at multiple sites simultaneously in both the higher-order auditory area NCM and the premotor area HVC of the songbird brain in awake zebra finches (Taeniopygia guttata). Bird's own song (BOS) and various conspecific songs (CON) were presented in both blocked and shuffled sequences. Neural responses showed plasticity in the form of stimulus-specific adaptation, with markedly different dynamics between the two structures. In NCM, the response decrease with repetition of each stimulus was gradual and long-lasting and did not differ between the stimuli or the stimulus presentation sequences. In contrast, HVC responses to CON stimuli decreased much more rapidly in the blocked than in the shuffled sequence. Furthermore, this decrease was more transient in HVC than in NCM, as shown by differential dynamics in the shuffled sequence. Responses to BOS in HVC decreased more gradually than to CON stimuli. The quality of neural representations, computed as the mutual information between stimuli and neural activity, was higher in NCM than in HVC. Conversely, internal functional correlations, estimated as the coherence between recording sites, were greater in HVC than in NCM. The cross-coherence between the two structures was weak and limited to low frequencies. These findings suggest that auditory communication signals are processed according to very different but complementary principles in NCM and HVC, a contrast that may inform study of the auditory and motor pathways for human speech processing.NEW & NOTEWORTHY Neural responses to auditory stimulation in sensory area NCM and premotor area HVC of the songbird forebrain show plasticity in the form of stimulus-specific adaptation with markedly different dynamics. These two structures also differ in stimulus representations and internal functional correlations. Accordingly, NCM seems to process the individually specific complex vocalizations of others based on prior familiarity, while HVC responses appear to be modulated by transitions and/or timing in the ongoing sequence of sounds.

Keywords: electrophysiology, songbird; mutual information; sensory-motor structures; stimulus-specific adaptation.


Figures

Fig. 1.
Fig. 1.
Diagram of the zebra finch auditory brain pathways and histological verification of electrode placement. A: 2 separate ascending pathways carry auditory information to the forebrain. Auditory input to NCM is relayed primarily by field L, whereas HVC receives input from interfacial nucleus of the nidopallium (NIf). Parts of caudal mesopallium (CM) are also reciprocally connected to NCM and HVC [via subsection avalanche (Av), see text for citations]. MLd, dorsal lateral mesencephalon; Ov, ovoidalis; Uva, uvaeformis; NCM, caudal medial nidopallium. B and C: darkfield photomicrographs of brain sections and DiI-labeled electrode tracks. Top is dorsal; right is anterior. Scaled drawings of the electrodes were used to include the recording sites that targeted NCM (B) and HVC (C) in statistical analyses. HPC, hippocampus.
Fig. 2.
Fig. 2.
Electrophysiological recordings and stimulus presentation sequences. A: example BOS and CON stimuli and the raw neural recordings that those stimuli elicited in NCM and HVC. Arrows on left indicate the thresholds for multiunit spike train extraction. B: 4 different stimuli were presented in a blocked sequence for half of the subjects (n = 8) and in a shuffled sequence for the other half. Each stimulus was presented 50 times. The positions of 4 different stimulus classes in the blocked sequence were counterbalanced across birds. B, BOS; C, CON (subscripts indicate acoustic similarity to BOS: L, low; M, mid; H, high).
Fig. 3.
Fig. 3.
Effect of stimulus presentation sequence on neural response magnitudes: mean neural response magnitudes in NCM and HVC over 50 presentations of BOS and CON stimuli in blocked and shuffled stimulus presentation sequences. The CON responses show the averages across all CON stimuli. A: in NCM, there was no difference between the blocked and shuffled sequences or between BOS and CON stimuli. B: in HVC, neural responses were greater for BOS than for CON. Response magnitudes show raw multiunit spikes/second. Error bars depict SEs. *Significant difference.
Fig. 4.
Fig. 4.
Novelty- and repetition-dependent dynamics in auditory responses. Gray dots depict NCM, and black dots depict HVC responses. CON subscripts indicate acoustic similarity to BOS: L, low; M, mid; H, high. A: example sites recorded in a blocked sequence, with the order of stimulus categories as indicated, showed clear novel stimulus-dependent increases in responses, which decreased gradually in NCM and rapidly in HVC with stimulus repetition. B: another set of example recordings as in A but with a different order of stimulus categories. C: example sites recorded in a shuffled sequence, with a random sequence of stimulus categories. D: the same recording sites as in C, but ordered by stimulus categories, showed decreases in neural responses with stimulus repetition. E: average of all sites recorded in the blocked sequence, as estimated by taking the average for each experimental trial number separately, irrespective of the stimulus category. Since the order of stimulus categories was counterbalanced across birds, each trial average is based on data from all 4 different stimulus categories. Fifty-trial blocks correspond to the 1st, 2nd, 3rd, and 4th stimuli as they were presented during the experiment for each bird. F: average of all sites recorded in the blocked sequence, as estimated by taking the average for each presentation of each stimulus category separately, irrespective of the experimental trial number. Fifty-trial blocks were ordered to show BOS and high-, mid-, and low-similarity CON stimuli for each bird. G and H: averages of all sites recorded in the shuffled sequence, as estimated in E and F, respectively. Response magnitudes show raw multiunit spikes/second.
Fig. 5.
Fig. 5.
Effect of stimulus presentation sequence (blocked vs. shuffled) on trial-by-trial dynamics of neural response magnitudes. The mean neural response magnitudes on the first and last 5 presentations of BOS and CON stimuli in blocked and shuffled sequences. A: in NCM, neural responses to BOS were not different between the 2 stimulus presentation sequences and showed gradual adaptation. B: CON responses in NCM also showed a similar gradual adaptation in the 2 sequences, except that the RMs on the second presentation were not statistically different from those on the first presentation in the shuffled sequence. C: in HVC, neural responses to BOS adapted gradually and were not different between the blocked and shuffled sequences. D: strikingly, CON responses in HVC showed differential dynamics in the 2 stimulus presentation sequences. In the blocked sequence, RMs on only the first presentation were greater than those in the last 5 repetitions; starting from the second presentation, responses were dramatically decreased in magnitude. In contrast, CON responses in the shuffled sequence showed a much more gradual adaptation. Response magnitudes show raw multiunit spikes/second. Error bars depict SEs. Trial-by-trial statistics of CON responses are summarized in Table 1.
Fig. 6.
Fig. 6.
Effects of stimulus transition and intervening stimulus presentations on trial-by-trial dynamics of neural response magnitudes. A and B: mean neural response magnitudes on the last 5 presentations of the preceding and on the first 5 presentations of the next CON stimulus. A: in NCM, neural responses were greater on all of the first 5 presentations of the next CON than on the last 5 presentations of the preceding CON. B: in HVC, neural responses were greater only on the first presentation of the next CON than on the last 5 presentations of the preceding CON. C: mean response magnitude change from the first to the second presentation of BOS and CON stimuli at different intervening stimulus presentation conditions. In NCM, neural responses decreased from the first to the second presentation when there were 0–1 and 2–6 presentations of intervening stimuli. In HVC, the decrease in neural responses was limited to 0–1 intervening stimulus presentations. Response magnitudes show raw multiunit spikes/second. Error bars depict SEs. *Significant differences between the last 5 presentations of the previous stimulus and each of the first 5 presentations of the next stimulus in A and B and from 0 in C.
Fig. 7.
Fig. 7.
Mutual information between auditory stimuli and neural responses: mutual information (MI) between auditory stimuli and neural responses in NCM and HVC at 9 different temporal resolutions. At all timescales, MIs were greater in NCM than in HVC. Peak MIs were seen at temporal resolutions from 1 to 50 ms in NCM and at 5 and 10 ms in HVC. Error bars depict SEs. *Significant differences.
Fig. 8.
Fig. 8.
Coherence within and between NCM and HVC. A: coherence estimations within NCM, within HVC, and between NCM and HVC (cross-coherence) from 1 to 100 Hz. Baseline estimations show coherence values that would be expected if there was no significant functional correlation. Recording sites in HVC showed significant coherence at all frequencies up to 75 Hz. NCM recording sites were highly coherent at frequencies below 16 Hz. The cross-coherence between NCM and HVC was relatively weak and only significant at frequencies below 13 Hz. B: mean coherence estimations between recording site pairs with different distances in NCM and HVC. Functional correlations were significantly related to distance: coherence estimations decreased as the distance between recording sites increased in both NCM and HVC. C and D: mean coherence estimations for BOS and CON stimuli in blocked and shuffled sequences. C: in HVC, coherence was greater for BOS than for CON stimuli. D: cross-coherence between NCM and HVC was greater for CON than for BOS and was also greater in the shuffled than in the blocked sequence. Error bars depict within-subject SEs. *Significant differences.
Fig. 9.
Fig. 9.
Relationship between stimulus repetition, EEG power, and neural response magnitudes in NCM and HVC. A: mean correlation coefficients between trial-to-trial neural response magnitudes in both NCM and HVC and EEG power at frequencies from 1 to 100 Hz. NCM responses were negatively correlated with EEG power between 2 and ~30 Hz, whereas HVC responses were positively correlated with EEG power from 2 to ~12 Hz. B: mean correlation coefficients between stimulus repetition and neural responses. In both NCM and HVC, neural responses decreased with increasing stimulus repetition. C: mean partial correlation coefficients between stimulus repetition and neural responses, controlling for EEG power at 2–12 and 12–30 Hz. The neural responses were still negatively correlated with stimulus presentation number; thus EEG power was not a significant mediator for this relation. D: mean correlation coefficients between neural responses and EEG power at 2–12 and 12–30 Hz. In NCM neural responses decreased as EEG power increased, whereas no such relation was seen in HVC. E: mean partial correlation coefficients between neural responses and EEG power at 2–12 and 12–30 Hz, controlling for stimulus repetition. In NCM, there was no significant correlation. In HVC, a significant positive correlation was revealed between neural responses and EEG power at 2–12 Hz. Error bars depict SEs. *Significant differences from 0.

Similar articles

Cited by

References

    1. Akutagawa E, Konishi M. New brain pathways found in the vocal control system of a songbird. J Comp Neurol 518: 3086–3100, 2010. doi:10.1002/cne.22383. - DOI - PubMed
    1. Bolhuis JJ, Gahr M. Neural mechanisms of birdsong memory. Nat Rev Neurosci 7: 347–357, 2006. doi:10.1038/nrn1904. - DOI - PubMed
    1. Brenowitz EA. Altered perception of species-specific song by female birds after lesions of a forebrain nucleus. Science 251: 303–305, 1991. doi:10.1126/science.1987645. - DOI - PubMed
    1. Cardin JA, Raksin JN, Schmidt MF. Sensorimotor nucleus NIf is necessary for auditory processing but not vocal motor output in the avian song system. J Neurophysiol 93: 2157–2166, 2005. doi:10.1152/jn.01001.2004. - DOI - PubMed
    1. Cardin JA, Schmidt MF. Song system auditory responses are stable and highly tuned during sedation, rapidly modulated and unselective during wakefulness, and suppressed by arousal. J Neurophysiol 90: 2884–2899, 2003. doi:10.1152/jn.00391.2003. - DOI - PubMed

Publication types

LinkOut - more resources