. 2017 Mar 1;117(3):1320-1341.
doi: 10.1152/jn.00575.2016. Epub 2016 Dec 28.

Neurons derived from different brain regions are inherently different in vitro: a novel multiregional brain-on-a-chip

Affiliations

Neurons derived from different brain regions are inherently different in vitro: a novel multiregional brain-on-a-chip

Stephanie Dauth et al. J Neurophysiol. .

Abstract

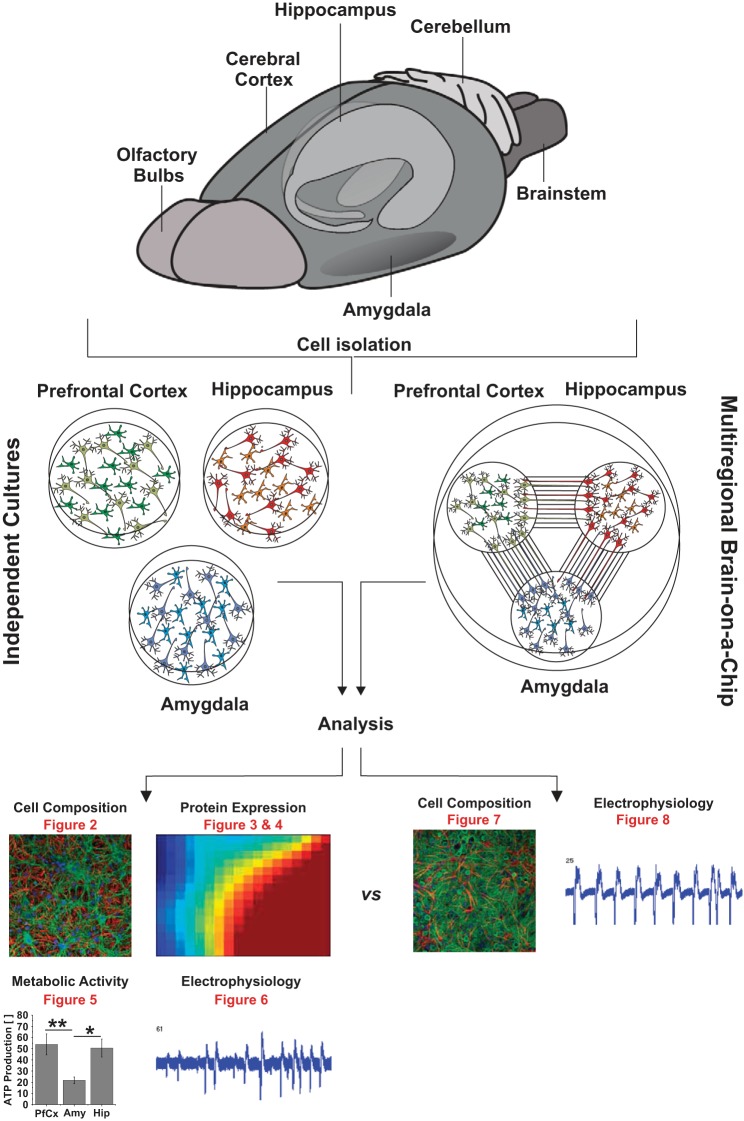
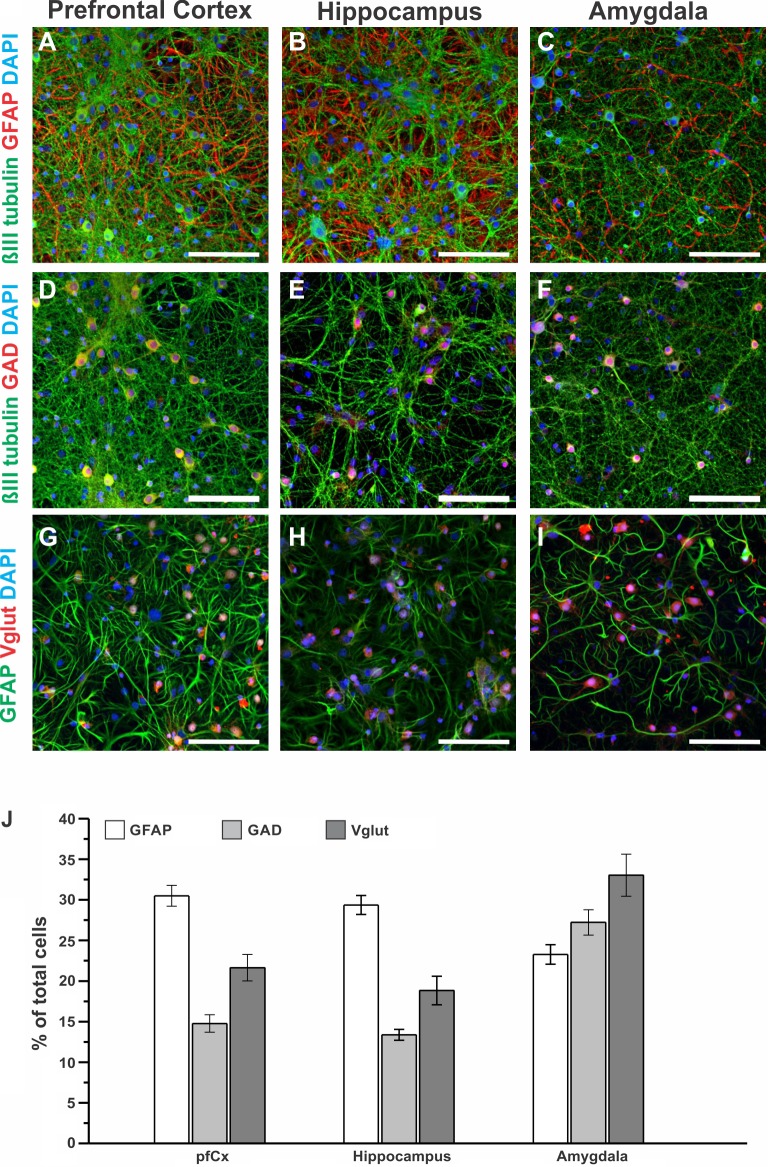
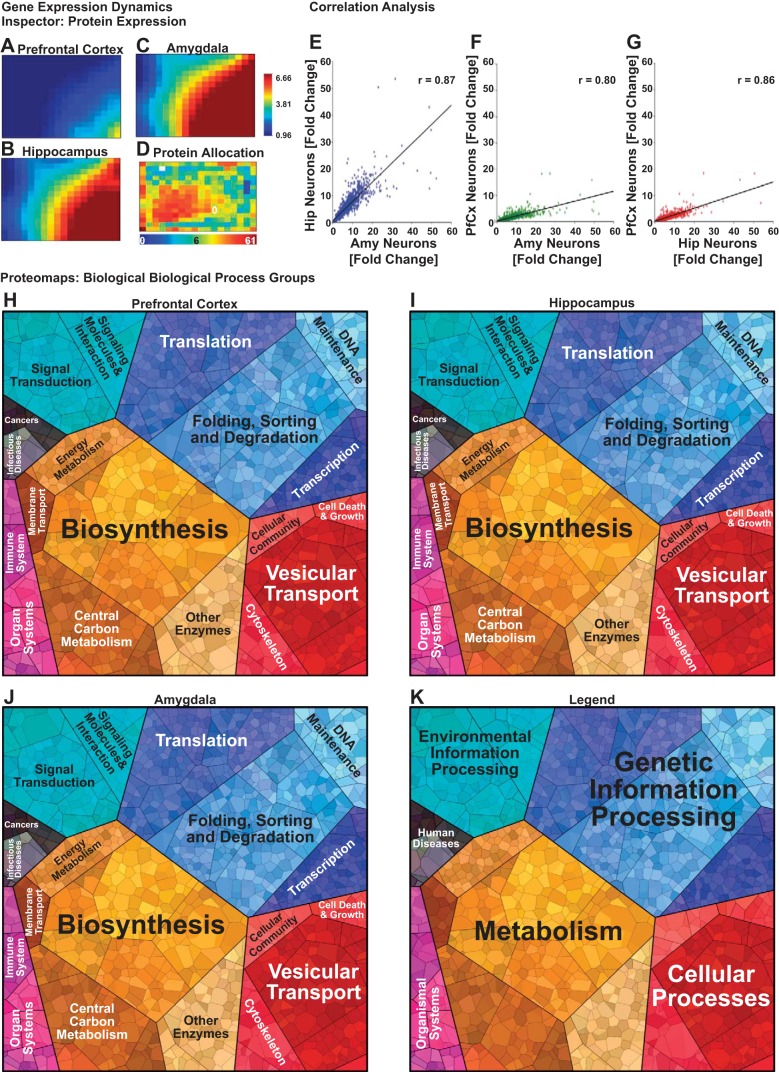
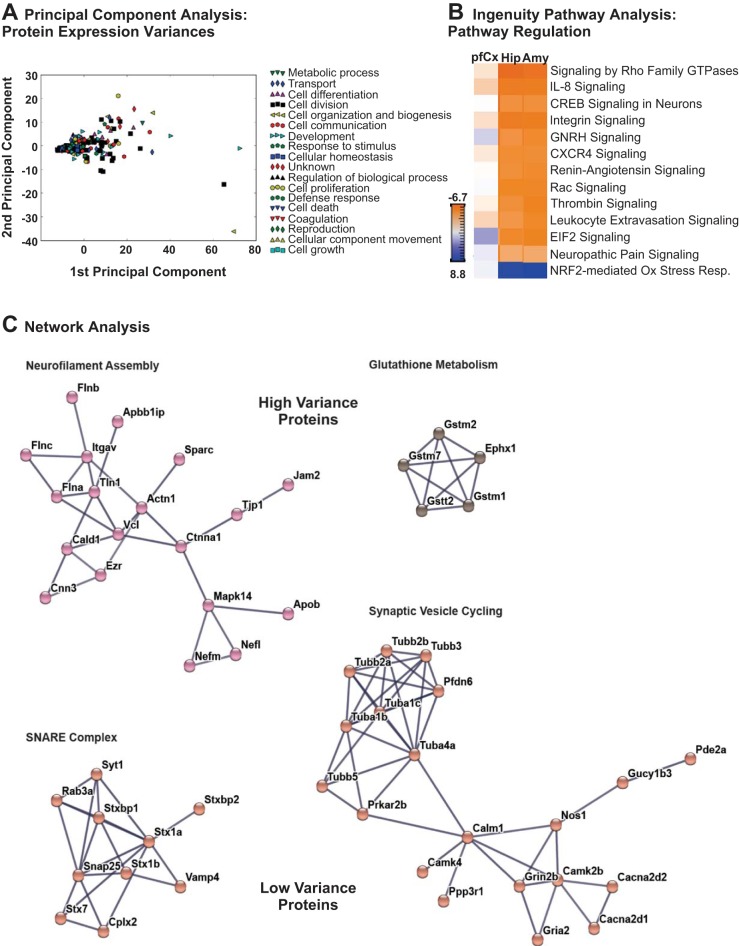
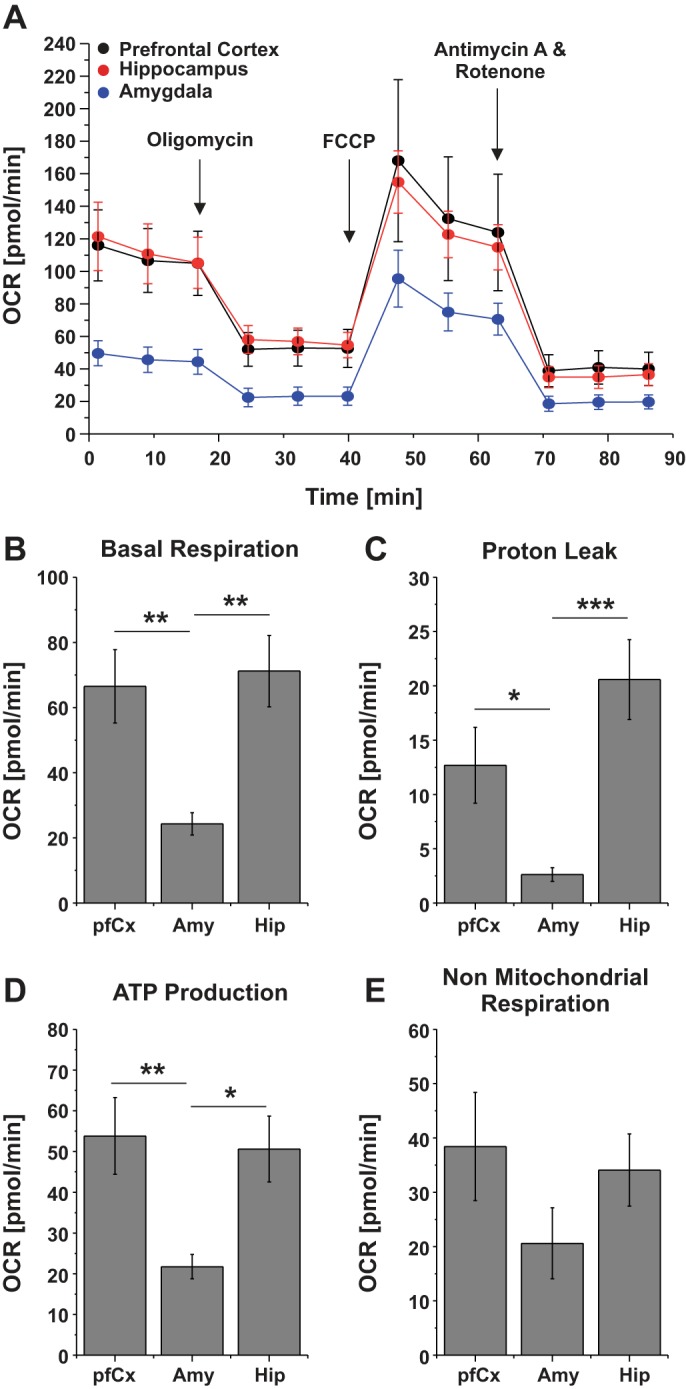
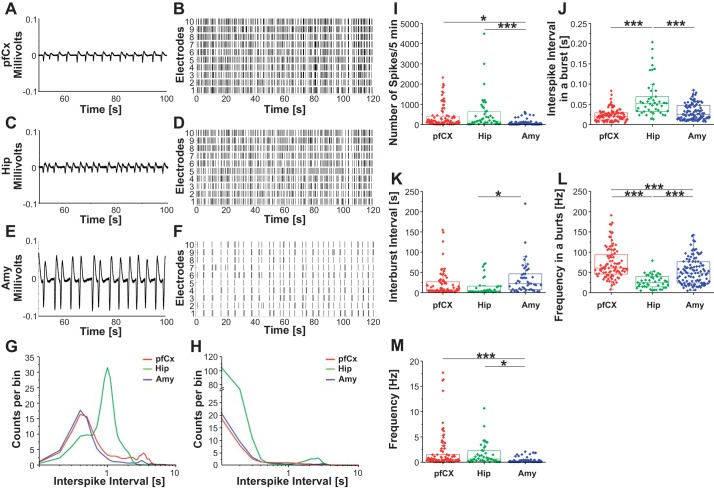
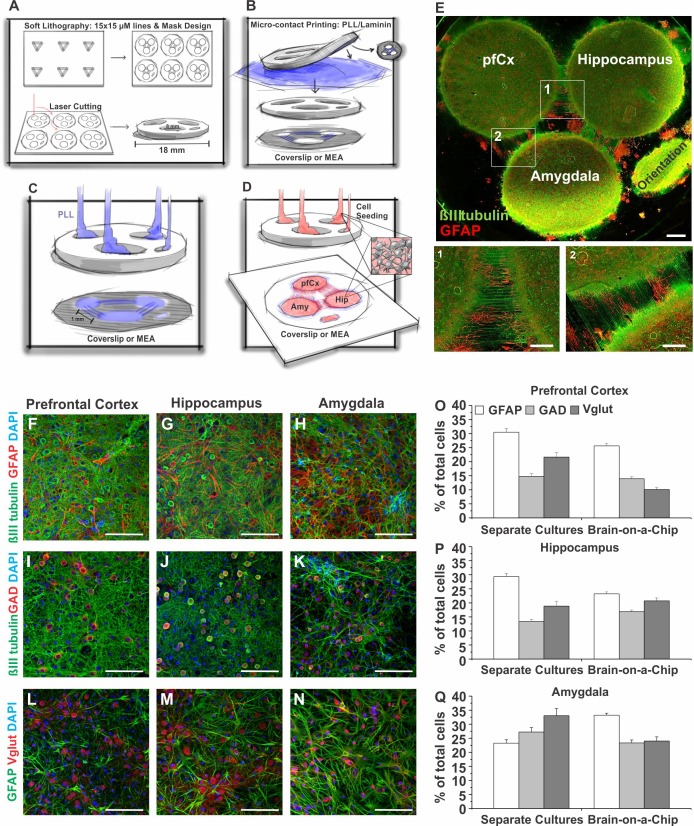
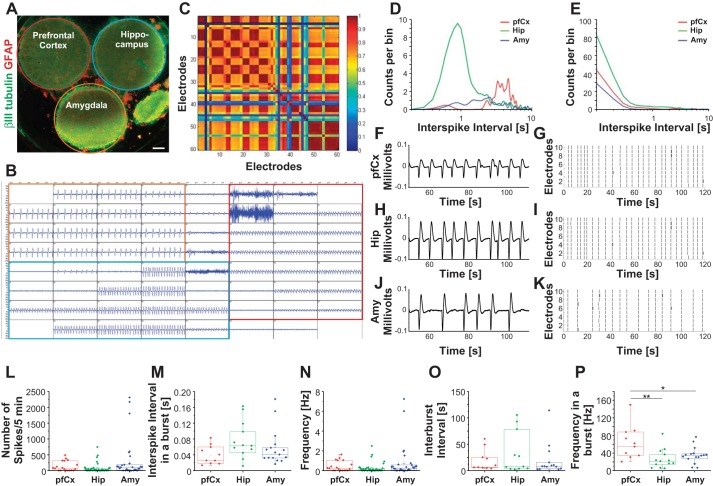
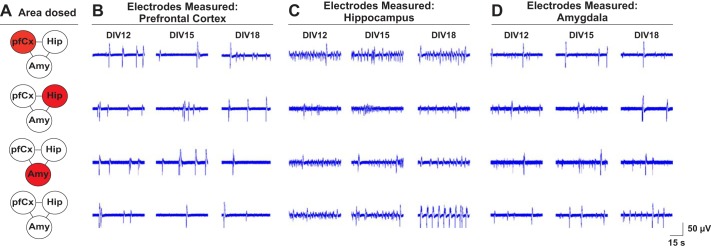
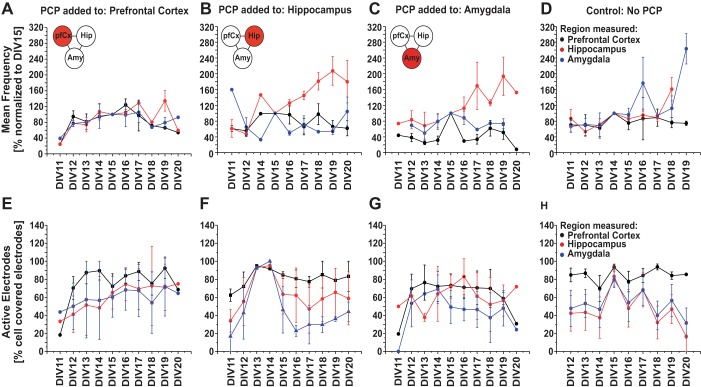
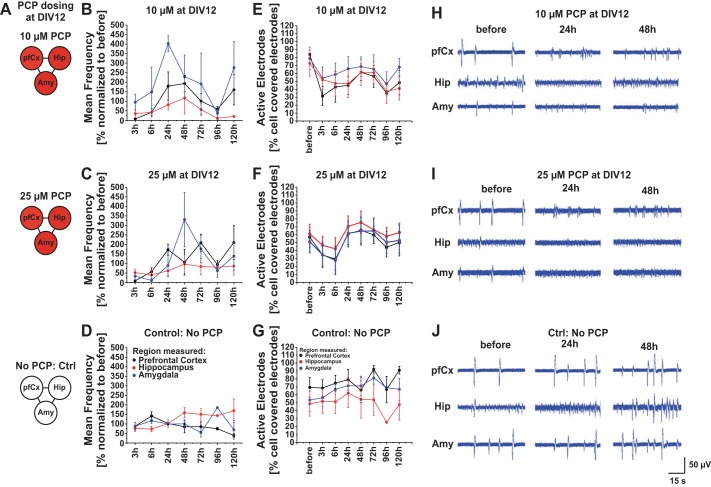
Brain in vitro models are critically important to developing our understanding of basic nervous system cellular physiology, potential neurotoxic effects of chemicals, and specific cellular mechanisms of many disease states. In this study, we sought to address key shortcomings of current brain in vitro models: the scarcity of comparative data for cells originating from distinct brain regions and the lack of multiregional brain in vitro models. We demonstrated that rat neurons from different brain regions exhibit unique profiles regarding their cell composition, protein expression, metabolism, and electrical activity in vitro. In vivo, the brain is unique in its structural and functional organization, and the interactions and communication between different brain areas are essential components of proper brain function. This fact and the observation that neurons from different areas of the brain exhibit unique behaviors in vitro underline the importance of establishing multiregional brain in vitro models. Therefore, we here developed a multiregional brain-on-a-chip and observed a reduction of overall firing activity, as well as altered amounts of astrocytes and specific neuronal cell types compared with separately cultured neurons. Furthermore, this multiregional model was used to study the effects of phencyclidine, a drug known to induce schizophrenia-like symptoms in vivo, on individual brain areas separately while monitoring downstream effects on interconnected regions. Overall, this work provides a comparison of cells from different brain regions in vitro and introduces a multiregional brain-on-a-chip that enables the development of unique disease models incorporating essential in vivo features.NEW & NOTEWORTHY Due to the scarcity of comparative data for cells from different brain regions in vitro, we demonstrated that neurons isolated from distinct brain areas exhibit unique behaviors in vitro. Moreover, in vivo proper brain function is dependent on the connection and communication of several brain regions, underlining the importance of developing multiregional brain in vitro models. We introduced a novel brain-on-a-chip model, implementing essential in vivo features, such as different brain areas and their functional connections.

Keywords: brain-on-a-chip; different brain regions; electrophysiology; metabolism; protein expression.


Figures

Fig. 1.
Fig. 1.
Project overview. The prefrontal cortex, the hippocampus, and the amygdala were dissected from 2-day-old Sprague-Dawley rats. Neurons (and astrocytes) were isolated from each brain region and either cultured individually (middle left) or together (middle right) as a multiregional brain-on-a-chip model. Individual cultures were analyzed regarding their protein expression (Fig. 2), cell composition (Figs. 3 and 4), metabolic activity (Fig. 5), and electrical activity (Fig. 6). The multiregional brain-on-a-chip consisting of all three brain regions was analyzed concerning its cell composition (Fig. 7) and electrical activity (Fig. 8). Results were compared between the multiregional brain-on-a-chip and the individual cultures.
Fig. 2.
Fig. 2.
Neuronal and glial markers in independent neuronal cultures derived from different brain regions. A–I: independent neuronal cultures isolated from the pfCx, the Hip, and the Amy were fixed 14 DIV and stained for βIII tubulin (neurons, green), glial fibrillary acidic protein (GFAP; astrocytes, red or green), and 4′,6-diamidino-2-phenylindole (DAPI; nucleus, blue) (A–C); βIII tubulin (green), glutamate decarboxylase (GAD; GABAergic neurons, red), and DAPI (blue) (D–F); and GFAP (green), vesicular glutamate transporter (Vglut, glutamatergic neurons, red), and DAPI (blue) (G–I). Scale bars = 100 μm. J: quantification of the amount of cells positive for GFAP, GAD, and Vglut for cells isolated from the pfCx, the Hip, and the Amy are shown as percentage of total cell number, ranging from around 10% to 35%, depending on the cell type. Values are means ± SE. Significance levels are presented in Table 1. GFAP and GAD: n  = each region 17–20 images, 4 coverslips; Vglut: n = 8–10 images, 2 coverslips.
Fig. 3.
Fig. 3.
Protein expression analyses of different brain regions in vitro. Protein expression was measured via mass spectrometry in 14 DIV old neuronal cultures derived from the prefrontal cortex (pfCx; A), hippocampus (Hip; B), and amygdala (Amy; C), and global protein expression profiles were visualized using gene expression dynamics inspector (GEDI) software. A self-organizing map algorithm was trained on the data set and used to generate mosaics visualizing the expression profiles for each brain region, wherein each tile of the mosaic represents a group of proteins with similar expression profiles. Red colored tiles indicate a high-fold change in protein expression relative to the control (neonate pfCx), whereas blue represents low-fold change. D: proteins were allocated to each tile of the GEDI mosaic according to their expression profile. Red tiles indicate a large number of assigned proteins, whereas blue colored tiles indicate fewer assigned proteins. Pearson product-moment correlation was used to assess the linear correlation between the global expression profiles measured for Hip vs. Amy (r = 0.87) (E), pfCx vs. Amy (r = 0.80) (F), and pfCx vs. Hip (r = 0.86) (G). Proteomaps were used to visualize the KEGG orthology biological process terms associated with proteins exhibiting twofold or greater expression levels in the pfCx (H), Hip (I), and Amy (J) brain regions using Voronoi diagrams, wherein each polygon represents an individual protein, and polygon area is a function of expression level. K: the polygons in the proteomaps are subdivided and color coded according to the top level KEGG orthology biological process terms represented in the protein expression profiles for each brain region.
Fig. 4.
Fig. 4.
Protein expression variation and protein interaction network analysis of cells derived from different brain regions. A: principal component analysis (PCA) was used to assess the expression variation and abundance of proteins associated with the primary gene ontology biological process terms represented in the mass spectrometry data for each brain region sample. Examples of proteins exhibiting the highest levels of variance between the prefrontal cortex (pfCx), hippocampus (Hip), and amygdala (Amy) samples are shown in Table 2. B: ingenuity pathway analysis (IPA) was used to identify biological pathways associated with proteins identified in the mass spectrometry data for the pfCx, Hip, and Amy brain regions, and a heatmap visualizing the top 13 most represented pathways is shown. The heatmap is color-coded according to z-scores, indicating the level of enrichment for each pathway based on the expression profiles for each brain region. C: protein-protein interaction networks were constructed using the STRING database to identify protein complexes represented in the mass spectrometry data associated with proteins exhibiting both the most variance in expression between brain regions (neurofilament assembly and glutathione metabolism) and the most similar expression levels between brain regions (SNARE complex and synaptic vesicle cycling). The length of the edges between each pair of protein nodes in the protein-protein interaction networks was computed using a spring-like model to cluster higher confidence protein-protein interactions closer together into functionally-related clusters.
Fig. 5.
Fig. 5.
Metabolic activity of cells derived from different brain regions. A: the oxygen consumption rate (OCR) of neuronal cultures from the pfCx, the Hip, and the Amy was measured after 14 DIV. Modulators of respiration were used to target components of the electron transport chain in the mitochondria to observe key parameters of metabolic function. B: basal respiration is assessed before the compounds (oligomycin, FCCP, and a mix of rotenone and antimycin A) and are serially injected to measure and calculate the proton leak (C), ATP production (D), and nonmitochondrial respiration (E). Values are means ± SE; n = 4 plates, 80 wells (pfCx); 3 plates, 60 wells (Hip); and 7 plates, 140 wells (Amy). All samples were seeded at the same cell density (100 K/well). Significances are indicated as follows: *P ≤ 0.05, **P ≤ 0.01, and ***P ≤ 0.001.
Fig. 6.
Fig. 6.
Electrophysiology of prefrontal cortex, hippocampal, and amygdala neurons in vitro. Electrical activity was recorded from 18 DIV neuronal cultures. A representative example of a typical waveform of PfCx (A), Hip (C), and Amy (E) recordings, as well as the corresponding raster plots (B, D, and F) for the respective regions are depicted. Each line in the raster blot represents a neuronal spike (electrical firing activity). G and H: interspike intervals were measured from the pfCx cells (red), Hip cells (green), and Amy cells (blue) using a band-pass filter (50 Hz; G) or a high-pass filter (125 Hz; H). I–M: recordings were further used to analyze number of spikes/5 min (I), interspike interval in a burst (J), interburst interval (K), frequency in a burst (L), and overall frequency (M). Significance levels were analyzed using ANOVA one-way analysis with a Bonferroni post hoc test. Values are means ± SE; n = 3 MEAs/brain region, 60 electrodes each, 5-min recordings. Significances are indicated as follows: *P ≤ 0.05, ***P ≤ 0.001.
Fig. 7.
Fig. 7.
Novel brain-on-a-chip model comprised of different brain regions. A–D: PDMS mask preparation and seeding procedure for brain-on-a-chip model. A: first an ~1-mm-thick PDMS sheet is laser cut to receive the masks, with 3 wells being 1 mm apart. Line features are engraved on the bottom side of the PDMS mask. B: the line features are then coated with PLL/laminin and air-dried, before being stamped on a coverslip or a MEA. C: wells are filled with PLL to coat the coverslip or MEA surface. D: PLL is washed away before cells from the different brain regions are seeded in the separated wells of the mask. One hour after seeding, masks are removed. Cells will now start growing axons using the microcontact printed PLL/laminin lines as physical cues to connect to the cells from the other brain regions. E: example image of the in vitro model 14 DIV immunostained for βIII tubulin (green) and GFAP (red). Close-up images of axons that have been grown over the 1-mm gap on the microcontact printed PLL/laminin lines connecting the different brain regions (1, 2). The multiregional brain-on-a-chip was stained for βIII-tubulin (green), GFAP (red), and DAPI as a nuclear counterstain (F–H); for βIII tubulin (green), glutamate decarboxylase 1 (GAD1, red), and DAPI (I–K); and for GFAP (green), vesicular glutamate transporter 1 (Vglut, red), and DAPI (L–N). O–Q: quantification of the number (percentage of total cells) of GFAP-, GAD1-, and Vglut-positive cells in pfCx (O), Hip (P), and Amy (Q) areas of the multiregional brain model in comparison to the number of GFAP-, GAD1-, and Vglut-positive cells in pfCx, Hip, and Amy cultures seeded and cultured separately (from Fig. 2). Values are means ± SE; GFAP: n = 31–46 images/region, 4 coverslips; GAD: n = 46–54 images, 4 coverslips; Vglut: n = 20–23 images, 4 coverslips. Scale bars = 1 mm (E), 500 μm (1, 2), 100 μm (F–N). Significance levels are presented in Table 1.
Fig. 8.
Fig. 8.
Electrophysiology of the multiregional brain-on-a-chip model. Electrical activity was recorded from 18 DIV multiregional brain-on-a-chip models. A: multiregional brain-on-a-chip immunostained for βIII-tubulin (green) and glial fibrillary acidic protein (GFAP, red) depicts pfCx (red outline), Hip (blue outline), and Amy cells (orange outline). B: example of an electrical recording (MEA, 60 electrodes) for the multiregional brain model is depicted. Electrodes recording pfCx cell activity are outlined in red, Hip electrodes are outlined in blue, and Amy electrodes are outlined in orange. C: cross-correlation analysis of the different regions of the brain-on-a-chip. Red color indicates a high correlation between network activity, while blue indicates a low correlation. D and E: interspike intervals were measured from pfCx area (red), Hip area (green), and Amy area (blue) using a band-pass filter (50 Hz; D) or a high-pass filter (125 Hz; E). F–K: representative example of a typical waveform. pfCx (F), Hip (H), and Amy (J) recordings are depicted. G, I, and K: raster plots are shown for each brain area, with each line representing a spike. L–P: recordings were further used to analyze number of spikes/5 min (L), interspike interval in a burst (M), interburst interval (N), frequency in a burst (O), and overall frequency (P). n = 3 MEAs, 6–20 electrodes/area, 5-min recordings. Significance levels were analyzed using ANOVA one-way analysis with a Bonferroni post hoc test. Significances are indicated as follows: *P ≤ 0.05, **P ≤ 0.001.
Fig. 9.
Fig. 9.
Assessment of electrical activity of the different brain areas of the multiregional brain-on-a-chip model after phencyclidine dosage. A: the multiregional brain-on-a-chip model was dosed with 5 µM phencyclidine (PCP) at seeding, and electrical activity was measured at DIV 12 until DIV 20. A control with no PCP addition was measured in parallel on the same days. Example traces for the pfCx (B), the Hip (C), and the Amy (D) of DIV 12, DIV 15, and DIV 18 are shown for each dosage condition (A). Traces represent one electrode for the different time points and depict 60 s of a 5-min recording. N = 4–5 MEAs/condition, 8–20 electrodes/area, 5-min recordings/time point.
Fig. 10.
Fig. 10.
Assessment of electrical activity of the multiregional brain-on-a-chip model dosed with phencyclidine (PCP) at seeding. The brain-on-a-chip model was dosed with 5 µM PCP at seeding, and electrical activity was measured at DIV 11 until DIV 20. PCP was added to one brain area only (either pfCx, or Hip, or Amy, see Fig. 9). A control with no PCP addition was measured in parallel on the same days. A–D: mean frequency was analyzed for each condition and day and normalized to DIV 15 frequency. Frequency measured within the pfCx area is represented by black dots/lines, Hip area by red, and Amy area by blue. E–H: active electrodes were plotted over time for all the conditions. Active electrodes represent the percentage of electrodes that show an electrical signal compared with the electrodes that are covered by cells for each brain area. Values are means ± SE; n = 4–5 MEAs, 8–20 electrodes/area, 5-min recordings/time point.
Fig. 11.
Fig. 11.
Assessment of electrical activity of the multiregional brain-on-a-chip model dosed at DIV 12. A: the multiregional brain-on-a-chip model was dosed with 10 µM, 25 µM, or no phencyclidine (PCP) at DIV 12, and electrical activity was measured before PCP addition, as well as at several time points after drug dosage (3 h, 6 h, 24 h, 48 h, 72 h, 96 h, and 120 h). B–D: mean frequency of all time points was normalized to the mean frequency measured before drug addition. PfCx area is represented by black dots/lines, hippocampal area by red, and amygdala area by blue. E–G: active electrodes were plotted over time for all the conditions. Active electrodes represent the percentage of electrodes that show an electrical signal compared with the electrodes that are covered by cells for each brain area. H–J: example traces for the pfCx, the Hip, and the Amy are depicted for each condition for the three different time points (before PCP addition, 24 h and 48 h after PCP addition). Traces represent one electrode for the different time points and depict 60 s of a 5-min recording. Values are means ± SE; n = 4–5 MEAs, 8–20 electrodes/area, 5-min recordings/time point.

Similar articles

Cited by

References

    1. Achermann P, Borbély AA. Low-frequency (<1 Hz) oscillations in the human sleep electroencephalogram. Neuroscience 81: 213–222, 1997. doi:10.1016/S0306-4522(97)00186-3. - DOI - PubMed
    1. Adachi N, Numakawa T, Kumamaru E, Itami C, Chiba S, Iijima Y, Richards M, Katoh-Semba R, Kunugi H. Phencyclidine-induced decrease of synaptic connectivity via inhibition of BDNF secretion in cultured cortical neurons. Cereb Cortex 23: 847–858, 2013. doi:10.1093/cercor/bhs074. - DOI - PubMed
    1. Alpert AJ. Electrostatic repulsion hydrophilic interaction chromatography for isocratic separation of charged solutes and selective isolation of phosphopeptides. Anal Chem 80: 62–76, 2008. doi:10.1021/ac070997p. - DOI - PubMed
    1. Anderson NG, Anderson NL. Twenty years of two-dimensional electrophoresis: past, present and future. Electrophoresis 17: 443–453, 1996. doi:10.1002/elps.1150170303. - DOI - PubMed
    1. Asher RA, Morgenstern DA, Moon LD, Fawcett JW. Chondroitin sulphate proteoglycans: inhibitory components of the glial scar. Prog Brain Res 132: 611–619, 2001. doi:10.1016/S0079-6123(01)32106-4. - DOI - PubMed

Publication types

MeSH terms

LinkOut - more resources