

Physiological processes influencing motor-evoked potential duration with voluntary contraction
- PMID: 28031404
- PMCID: PMC5340882
- DOI: 10.1152/jn.00832.2016
Physiological processes influencing motor-evoked potential duration with voluntary contraction
Abstract
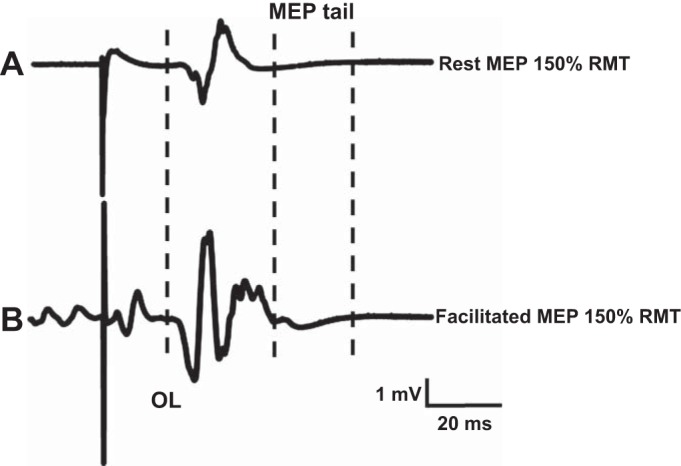
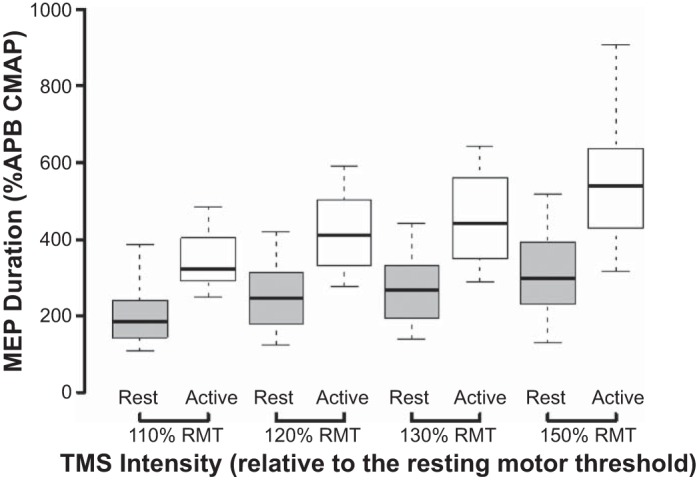
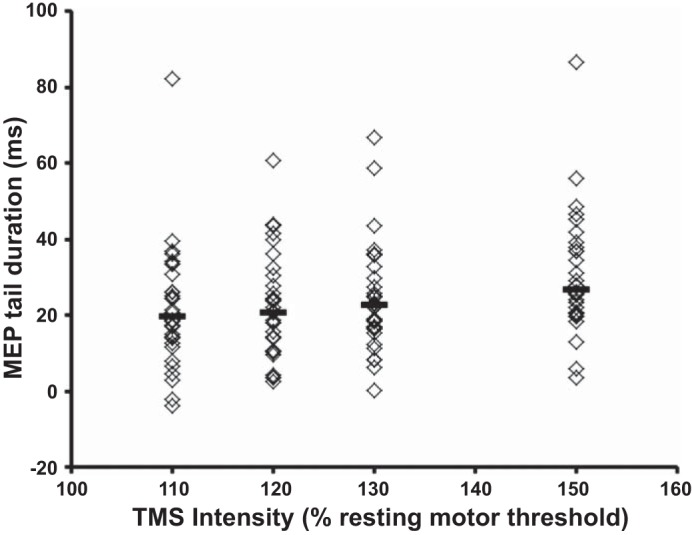
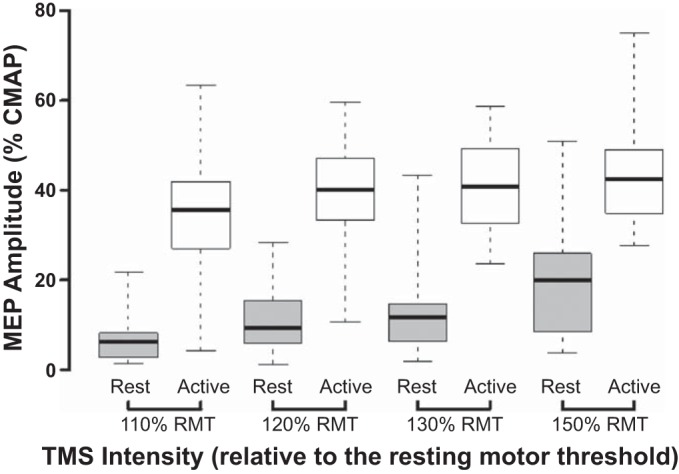
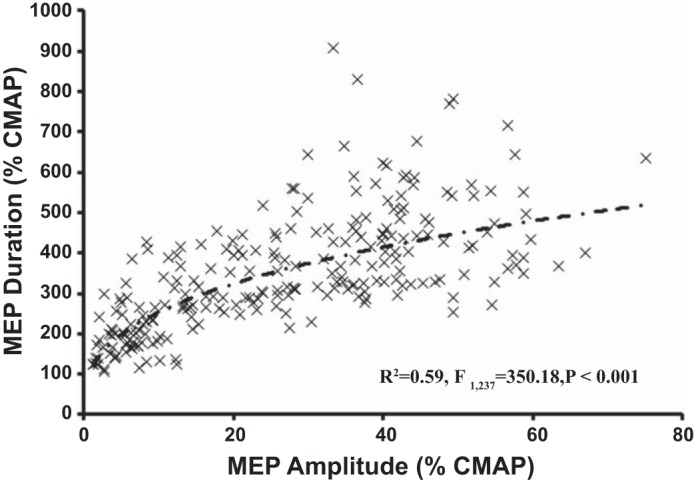
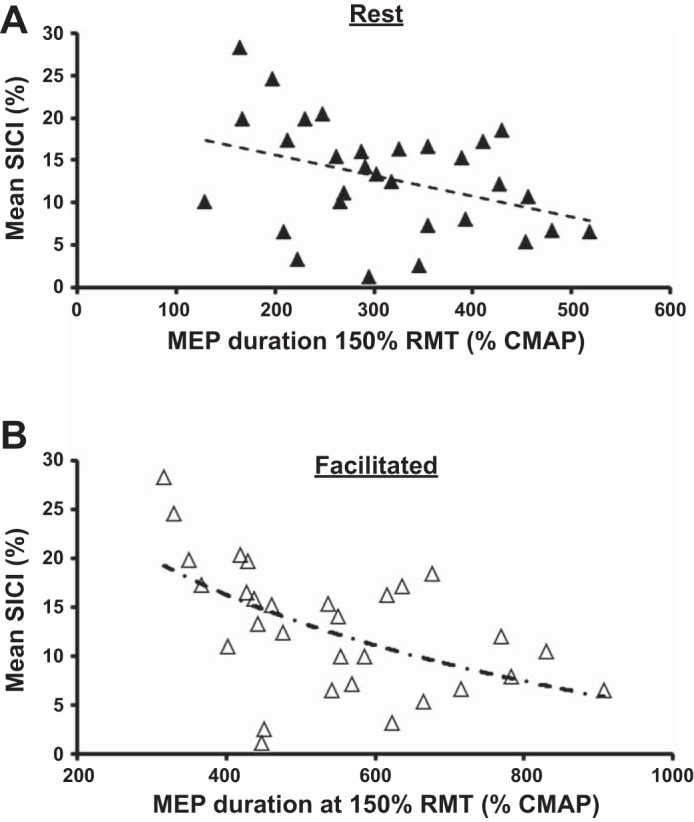
Voluntary contraction leads to facilitation of motor-evoked potentials (MEPs) producing greater amplitude, shorter onset latency, and prolonged duration of the electromyography potential. Whereas hyperexcitability of spinal motoneurons and changes in descending corticospinal volleys have been proposed as putative mechanisms for changes in MEP amplitude and onset latency, a contribution of propriospinal interneurons, exerting modulatory effects on α-motoneurons, has been proposed as a potential explanation for prolongation of MEP duration. The aim of the present study is to gain further insight into the physiological processes underlying changes in MEP duration. Transcranial magnetic stimulation (TMS) studies were undertaken on 30 healthy controls, using a 90-mm circular coil, with MEPs recorded at rest and during facilitation, produced by contraction of abductor pollicis brevis. In the same experiment, short interval-intracortical inhibition (SICI) was recorded at rest. Facilitation resulted in a significant prolongation of MEP duration, which increased with stimulus intensity and was accompanied by an increase in MEP amplitude. The main effect (TMS intensity × activation state) was correlated with MEP duration (F = 10.9, P < 0.001), whereas TMS intensity (F = 30.5, P < 0.001) and activation state (F = 125.8, P < 0.001) in isolation were correlated with MEP amplitude. There was a significant inverse relationship between SICI and MEP duration at rest (R2 = 0.141, P = 0.041) and during facilitation (R2 = 0.340, P = 0.001). The present findings suggest that similar physiological processes mediate changes in the facilitated MEP duration and amplitude and that both cortical and nonpropriospinal spinal mechanisms contribute to changes in MEP duration.NEW & NOTEWORTHY Muscle contraction is associated with a significant increase in motor-evoked potential (MEP) duration and amplitude. Whereas the increase in MEP duration was linear, the amplitude increase exhibited a ceiling effect. Importantly, the MEP duration increase strongly correlated with short interval-intracortical inhibition, a biomarker of motor cortical function. This suggests that whereas similar physiological processes contribute to changes in facilitated MEP duration and amplitude, cortical mechanisms appear to contribute to MEP duration changes.
Keywords: MEP duration; cortical processes; propriospinal.
Copyright © 2017 the American Physiological Society.
Figures
Similar articles
-
Modulation of the cortical silent period elicited by single- and paired-pulse transcranial magnetic stimulation.BMC Neurosci. 2013 Apr 2;14:43. doi: 10.1186/1471-2202-14-43. BMC Neurosci. 2013. PMID: 23547559 Free PMC article.
-
Modulation of short- and long-interval intracortical inhibition with increasing motor evoked potential amplitude in a human hand muscle.Clin Neurophysiol. 2014 Jul;125(7):1440-50. doi: 10.1016/j.clinph.2013.11.015. Epub 2013 Nov 28. Clin Neurophysiol. 2014. PMID: 24345316 Clinical Trial.
-
Modulation of short-latency afferent inhibition and short-interval intracortical inhibition by test stimulus intensity and motor-evoked potential amplitude.Neuroreport. 2017 Dec 13;28(18):1202-1207. doi: 10.1097/WNR.0000000000000896. Neuroreport. 2017. PMID: 29064955
-
Myths and Methodologies: How loud is the story told by the transcranial magnetic stimulation-evoked silent period?Exp Physiol. 2019 May;104(5):635-642. doi: 10.1113/EP087557. Epub 2019 Mar 24. Exp Physiol. 2019. PMID: 30830992 Review.
-
Motor potentials evoked by transcranial magnetic stimulation: interpreting a simple measure of a complex system.J Physiol. 2023 Jul;601(14):2827-2851. doi: 10.1113/JP281885. Epub 2023 Jun 8. J Physiol. 2023. PMID: 37254441 Free PMC article. Review.
Cited by
-
Clinical neurophysiology of functional motor disorders: IFCN Handbook Chapter.Clin Neurophysiol Pract. 2024 Jan 24;9:69-77. doi: 10.1016/j.cnp.2023.12.006. eCollection 2024. Clin Neurophysiol Pract. 2024. PMID: 38352251 Free PMC article. Review.
-
Transcranial magnetic stimulation reveals diminished homoeostatic metaplasticity in cognitively impaired adults.Brain Commun. 2020 Nov 27;2(2):fcaa203. doi: 10.1093/braincomms/fcaa203. eCollection 2020. Brain Commun. 2020. PMID: 33376989 Free PMC article.
-
Intracortical and Intercortical Motor Disinhibition to Transcranial Magnetic Stimulation in Newly Diagnosed Celiac Disease Patients.Nutrients. 2021 May 1;13(5):1530. doi: 10.3390/nu13051530. Nutrients. 2021. PMID: 34062843 Free PMC article.
-
Neurophysiological Changes in the First Year After Cell Transplantation in Sub-acute Complete Paraplegia.Front Neurol. 2021 Jan 18;11:514181. doi: 10.3389/fneur.2020.514181. eCollection 2020. Front Neurol. 2021. PMID: 33536992 Free PMC article.
-
Characterizing off-target corticospinal responses to double-cone transcranial magnetic stimulation.Exp Brain Res. 2021 Apr;239(4):1099-1110. doi: 10.1007/s00221-021-06044-5. Epub 2021 Feb 6. Exp Brain Res. 2021. PMID: 33547521
References
-
- Chen R, Cros D, Curra A, Di Lazzaro V, Lefaucheur JP, Magistris MR, Mills K, Rösler KM, Triggs WJ, Ugawa Y, Ziemann U. The clinical diagnostic utility of transcranial magnetic stimulation: report of an IFCN committee. Clin Neurophysiol 119: 504–532, 2008. doi:10.1016/j.clinph.2007.10.014. - DOI - PubMed
Publication types
MeSH terms
LinkOut - more resources
Full Text Sources
Other Literature Sources