. 2017 Feb 10;292(6):2203-2216.
doi: 10.1074/jbc.M116.769885. Epub 2016 Dec 28.

New Roles of Syntaxin-1A in Insulin Granule Exocytosis and Replenishment

Affiliations

New Roles of Syntaxin-1A in Insulin Granule Exocytosis and Replenishment

Tao Liang et al. J Biol Chem. .

Abstract

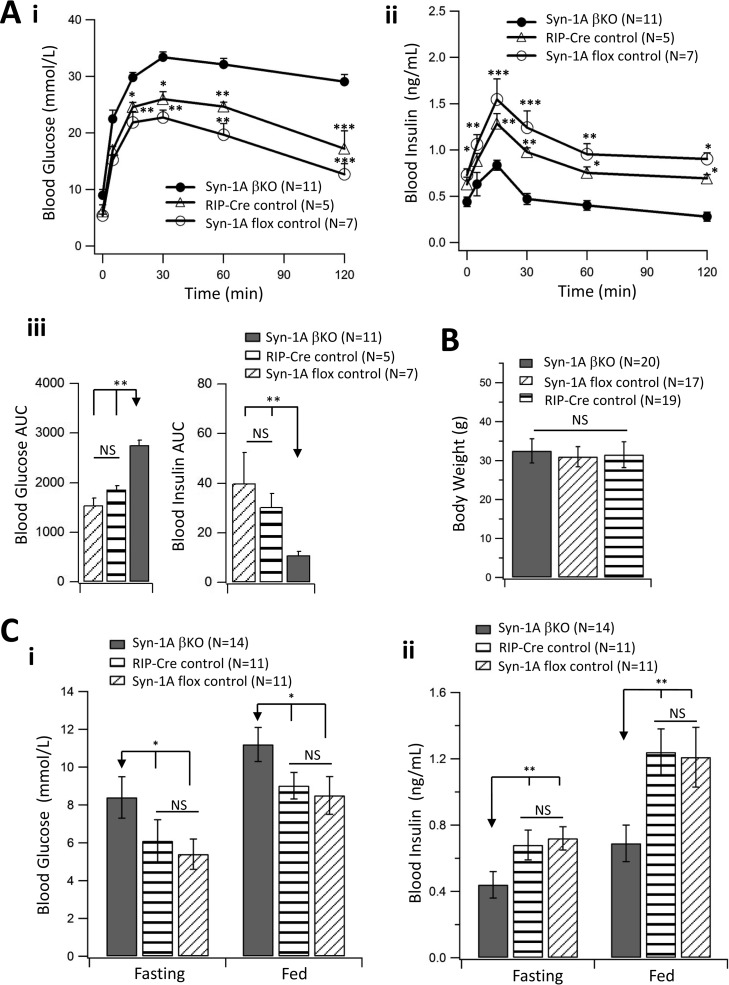
In type-2 diabetes (T2D), severely reduced islet syntaxin-1A (Syn-1A) levels contribute to insulin secretory deficiency. We generated β-cell-specific Syn-1A-KO (Syn-1A-βKO) mice to mimic β-cell Syn-1A deficiency in T2D. Glucose tolerance tests showed that Syn-1A-βKO mice exhibited blood glucose elevation corresponding to reduced blood insulin levels. Perifusion of Syn-1A-βKO islets showed impaired first- and second-phase glucose-stimulated insulin secretion (GSIS) resulting from reduction in readily releasable pool and granule pool refilling. To unequivocally determine the β-cell exocytotic defects caused by Syn-1A deletion, EM and total internal reflection fluorescence microscopy showed that Syn-1A-KO β-cells had a severe reduction in the number of secretory granules (SGs) docked onto the plasma membrane (PM) at rest and reduced SG recruitment to the PM after glucose stimulation, the latter indicating defects in replenishment of releasable pools required to sustain second-phase GSIS. Whereas reduced predocked SG fusion accounted for reduced first-phase GSIS, selective reduction of exocytosis of short-dock (but not no-dock) newcomer SGs accounted for the reduced second-phase GSIS. These Syn-1A actions on newcomer SGs were partly mediated by Syn-1A interactions with newcomer SG VAMP8.

Keywords: SNARE proteins; Syntaxin-1A; Type 2 diabetes; docking; exocytosis; granule replenishment; insulin secretion; newcomer insulin granule; transgenic mice.


Conflict of interest statement

The authors declare that they have no conflicts of interest with the contents of this article

Figures

FIGURE 1.
FIGURE 1.
Generation of β-cell-specific Syn-1A knock-out (Syn-1A-βKO) mouse. A, conditional targeting in R1 ES cells at the Syn-1A locus using the pNeolox-PTK vector resulted in the insertion of a Neo cassette flanked by FLP recombinase target (FRT) sites and loxP sites flanking exons 2 and 3. Correctly targeted (T) and wild type (WT) restriction fragment lengths when DNA was digested with SpeI and probed with the right arm (A) and left arm (B) probes are shown. Southern blotting analysis of targeted embryonic stem cells identified 14 heterozygously targeted clones. PCR analysis of ear punch genomic DNA shows the genotypes of offspring from Syn-1Aflox/+Cre+/− intercross used to generate Syn-1A βKO and littermate controls. Lane 1, Syn-1Aflox/floxCre+; lane 2, Syn-1Aflox/+Cre+; lane 3, Syn-1A+/+Cre+; lane 4, Syn-1Aflox/floxCre−. Syn-1Aflox/floxCre+ is the Syn-1A βKO mouse. B, reduction of Syn-1A protein levels in islets isolated from Syn-1A-βKO mice compared with Syn-1A flox control mice did not influence the expression of other SNARE or SM proteins. Shown are representative results of three independent experiments; analysis of protein expression is shown at the bottom. Results are shown as means ± S.E. NS, not significant; *, p < 0.01. C, confocal microscopy shows Syn-1A localization to β-cells (top), α-cells (middle), and δ-cells (bottom) in Syn-1A flox control mouse islets. Scale bar, 100 μm. D, Syn-1A-βKO mouse islet shows the absence of Syn-1A in insulin-positive β-cells (top) and shows residual Syn-1A in glucagon-positive α-cells (middle) and somatostatin-positive δ-cells (bottom). Scale bar, 100 μm. DIC, differential interference contrast.
FIGURE 2.
FIGURE 2.
Syn-1A-βKO mice exhibit glucose intolerance because of reduced blood insulin levels. A, Syn-1A-βKO mice are glucose-intolerant because of reduced insulin release into the circulation. IPGTTs were performed on Syn-1A-βKO (n = 11) versus control mice (RIP-Cre (n = 5) and Syn-1A flox (n = 7)), from which we obtained blood glucose (i) and plasma insulin levels (ii). iii, corresponding AUCs determined above basal levels for glucose (i) and insulin (ii) because basal levels are different between experiments. B, weights of Syn-1A-βKO mice (n = 20) versus control mice (RIP-Cre (n = 19) and Syn-1A flox (n = 17)) were not different. C, Syn-1A-βKO mice (n = 14) showed higher blood glucose levels (i) and lower insulin levels (ii) than control mice (RIP-Cre (n = 11) and Syn-1A flox (n = 11)) after an 18-h fast and during the fed state. Results are shown as means ± S.E. NS, not significant. *, p < 0.05; **, p < 0.01; ***, p < 0.001.
FIGURE 3.
FIGURE 3.
Syn-1A-βKO mouse islets exhibit reduced biphasic GSIS. A, islet perifusion assays in Syn-1A-βKO (n = 7) versus RIP-Cre control (n = 4) versus Syn-1A flox control (n = 7) pancreatic islets. B, corresponding AUCs (area under the curve, determined above basal levels) analysis of GSIS during basal conditions (2.8 mmol/liter glucose) and 16.7 mmol/liter stimulated first phase (10–20 min) and second phase (21–45 min). Summary graphs show means ± S.E. (error bars); NS, not significant; *, p < 0.05; ***, p < 0.001. C, islet insulin content was not significantly different between Syn-1A-βKO (n = 7) and control mice (RIP-Cre (n = 4) and Syn-1A flox (n = 7)).
FIGURE 4.
FIGURE 4.
Syn-1A deletion in mouse β-cells impairs insulin SG docking onto the plasma membrane at rest and recruitment to plasma membrane during stimulation. A, representative EM images of islets at basal conditions (2.8 mmol/liter glucose, top panels) and after stimulation (16.7 mm glucose for 15 min, middle panels) from control (Syn-1A flox, RIP-Cre) and Syn-1A-βKO mice from three independent experiments. The numbered bottom panels are enlarged views of the indicated areas in the middle panels. Scale bar, 500 nm. Black arrows, PM; white arrowheads, docked insulin SGs, which are almost absent in Syn-1A-βKO β cells at basal and stimulated conditions. B, diameter of SGs. C, number of SGs/μm2 of cytoplasmic area. D, number of morphologically docked insulin SGs/μm of PM. SGs at their shortest distance of <50 nm from PM were qualified as morphologically docked SGs (white arrowheads in A numbered panels). B–D, total number of SGs counted from three independent experiments: Syn-1A-βKO, 2.8 mm glucose, 13 micrographs, 3376 SGs; 16.7 mm glucose, 17 micrographs, 4224 SGs; Syn-1A flox control, 2.8 mm glucose, 13 micrographs, 3174 SGs; 16.7 mm glucose, 19 micrographs, 4984 SGs; RIP-Cre control, 2.8 mm glucose, 16 micrographs, 3990 SGs; 16.7 mm glucose, 19 micrographs, 4732 SGs. Values represent mean ± S.E. (error bars). E, relative density of SGs within 0.2-μm concentric shells beneath the PM at basal (2.8 mm glucose) and after 15-min 16.7 mm glucose stimulation. Data were represented as percentages of SG density within each concentric shell normalized to average SG density within the total cytoplasmic area from the PM to 1.5 μm into the cell interior. n = 12 micrographs each from three independent experiments. Values represent mean ± S.E. (error bars). NS, not significant; *, p < 0.05; **, p < 0.01; ***, p < 0.001.
FIGURE 5.
FIGURE 5.
Syn-1A deletion in mouse β-cells reduces the priming and mobilization of insulin SG pools. A–D, exocytosis in single islet β-cells (identified by Cm ≥ 10 picofarads) of Syn-1A-βKO versus Syn-1A flox control mice. A and B, representative recordings of exocytosis during a train of 500-ms depolarizations from −70 to 0 mV in Syn-1A flox control (A) and Syn-1A-βKO (B) β-cells. C, cumulative changes in cell capacitance normalized to basal cell membrane capacitance (fF/pF) in Syn-1A flox control (n = 22 cells) and Syn-1A-βKO (n = 17 cells) β-cells from three pairs of mice. Values represent mean ± S.E. (error bars); *, p < 0.05. D, size of the RRP of insulin SGs (ΔCm1st-2nd pulse) and rate of SG mobilization (ΔCm3rd-10th pulse) (n = 17–22 cells). Values represent mean ± S.E.; *, p < 0.05. E, representative traces showing Cav currents recorded in whole-cell mode from Syn-1A flox control versus Syn-1A-βKO mouse β-cells. F, current-voltage relationship of Cav channels of three pairs of Syn-1A flox control (n = 16 cells) versus Syn-1A-βKO mice β-cells (n = 20 cells) showed no significant difference. Currents were normalized to cell capacitance to yield current density.
FIGURE 6.
FIGURE 6.
TIRF microscopy showing that Syn-1A deletion reduces predocked SGs in first-phase and short dock newcomer SGs in second-phase GSIS. A, left, TIRF images of docked insulin SGs in Syn-1A flox control (n = 15) versus Syn-1A-βKO mouse β-cells (n = 21) from four pairs of mice. Scale bars, 2 μm. Right, averaged SG densities on the PM before stimulation. B, kymographs and corresponding fluorescence intensity curves showing three modes of insulin SG fusion events: “predock” (black bar), “newcomer-no dock” (white bar), and “newcomer-short dock” (gray bar). C, histogram of fusion events in first (first 4 min after 16.7 mmol/liter glucose stimulation) and second phases (5–12 min) in Syn-1A flox control (n = 15 cells) versus Syn-1A-βKO mouse β-cells (n = 18 cells). D, summary of the three modes of fusion events in first (left) and second phases (right). Values are shown as mean ± S.E. (error bars). NS, not significant; *, p < 0.05; **, p < 0.005; ***, p < 0.001.
FIGURE 7.
FIGURE 7.
Syn-1A interacts with VAMP2 and VAMP8 to form SM·SNARE complexes. A and B, GLP-1-potentiated glucose stimulation of INS-1 cells promotes formation of SNARE complexes (Syn-1A, SNAP25, VAMP2, or VAMP8). Ai, an example of co-IP of Syn-1A with analysis of three experiments (each experiment performed in duplicate) shown in Aii. Bi and Bii, the corresponding inputs. Preimmune IgG was used as a negative control (lane 1). Lanes 2 and 3, co-IP results with Syn-1A in non-stimulatory (0.8 mmol/liter glucose) and stimulatory (10 nmol/liter GLP-1 plus 16.7 mmol/liter glucose) conditions, respectively. Values are shown as mean ± S.E. (error bars). NS, not significant; *, p < 0.05.

References

    1. Rorsman P., Eliasson L., Renström E., Gromada J., Barg S., and Göpel S. (2000) The cell physiology of biphasic insulin secretion. News Physiol. Sci. 15, 72–77 - PubMed
    1. Gaisano H. Y. (2012) Deploying insulin granule-granule fusion to rescue deficient insulin secretion in diabetes. Diabetologia 55, 877–880 - PubMed
    1. Südhof T. C., and Rothman J. E. (2009) Membrane fusion: grappling with SNARE and SM proteins. Science 323, 474–477 - PMC - PubMed
    1. Hong W. (2005) SNAREs and traffic. Biochim. Biophys. Acta 1744, 493–517 - PubMed
    1. Oh E., Kalwat M. A., Kim M. J., Verhage M., and Thurmond D. C. (2012) Munc18–1 regulates first-phase insulin release by promoting granule docking to multiple syntaxin isoforms. J. Biol. Chem. 287, 25821–25833 - PMC - PubMed

Publication types

Grants and funding