. 2017 Feb;214(2):511-528.
doi: 10.1084/jem.20161452. Epub 2016 Dec 28.

Lipin-2 regulates NLRP3 inflammasome by affecting P2X7 receptor activation

Affiliations
Free PMC article

Lipin-2 regulates NLRP3 inflammasome by affecting P2X7 receptor activation

Gema Lordén et al. J Exp Med. 2017 Feb.
Free PMC article

Abstract

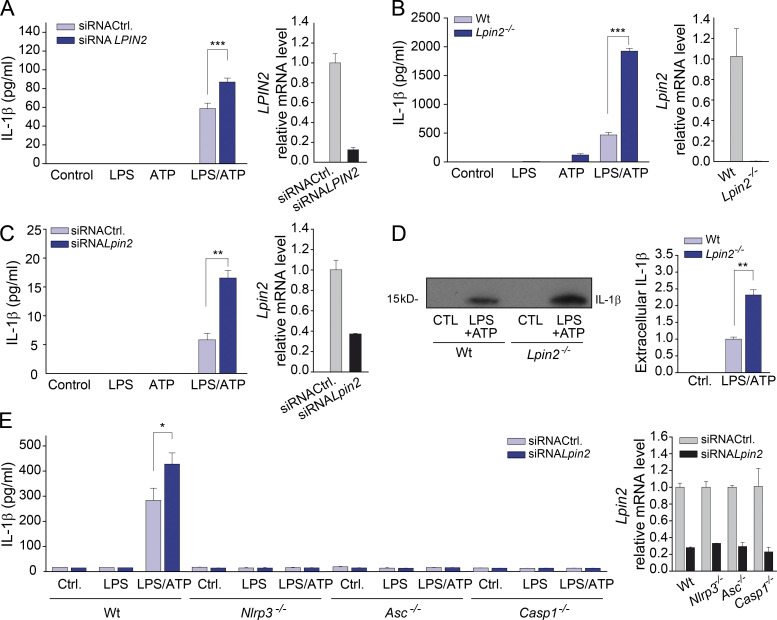
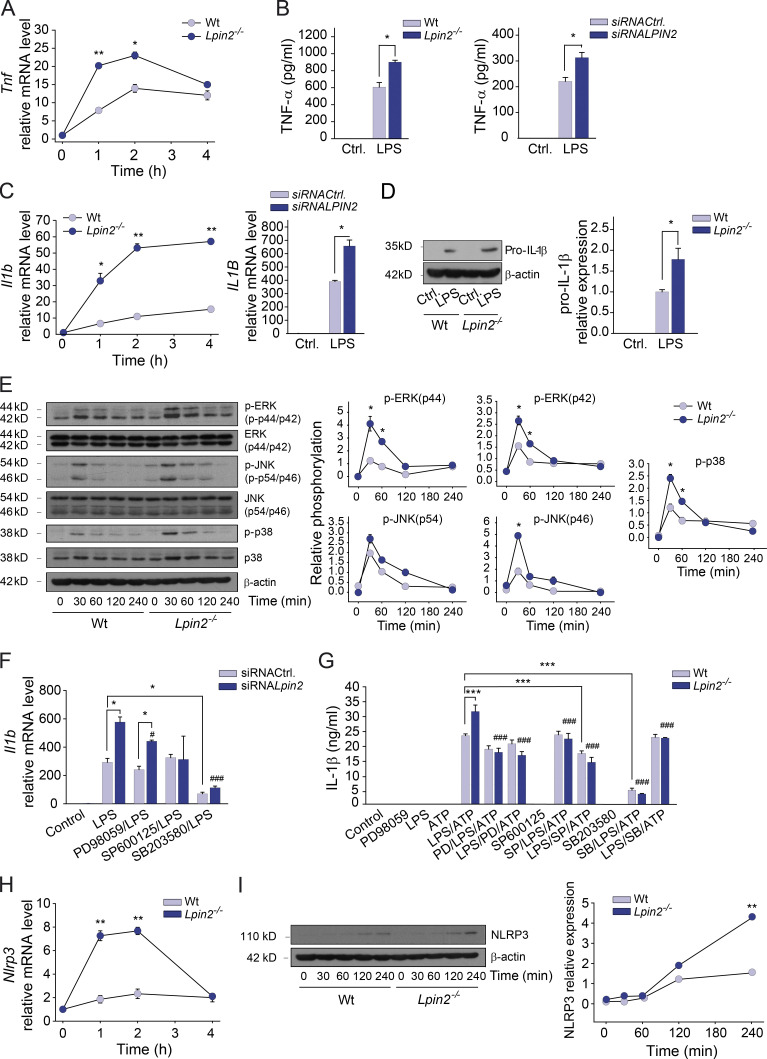
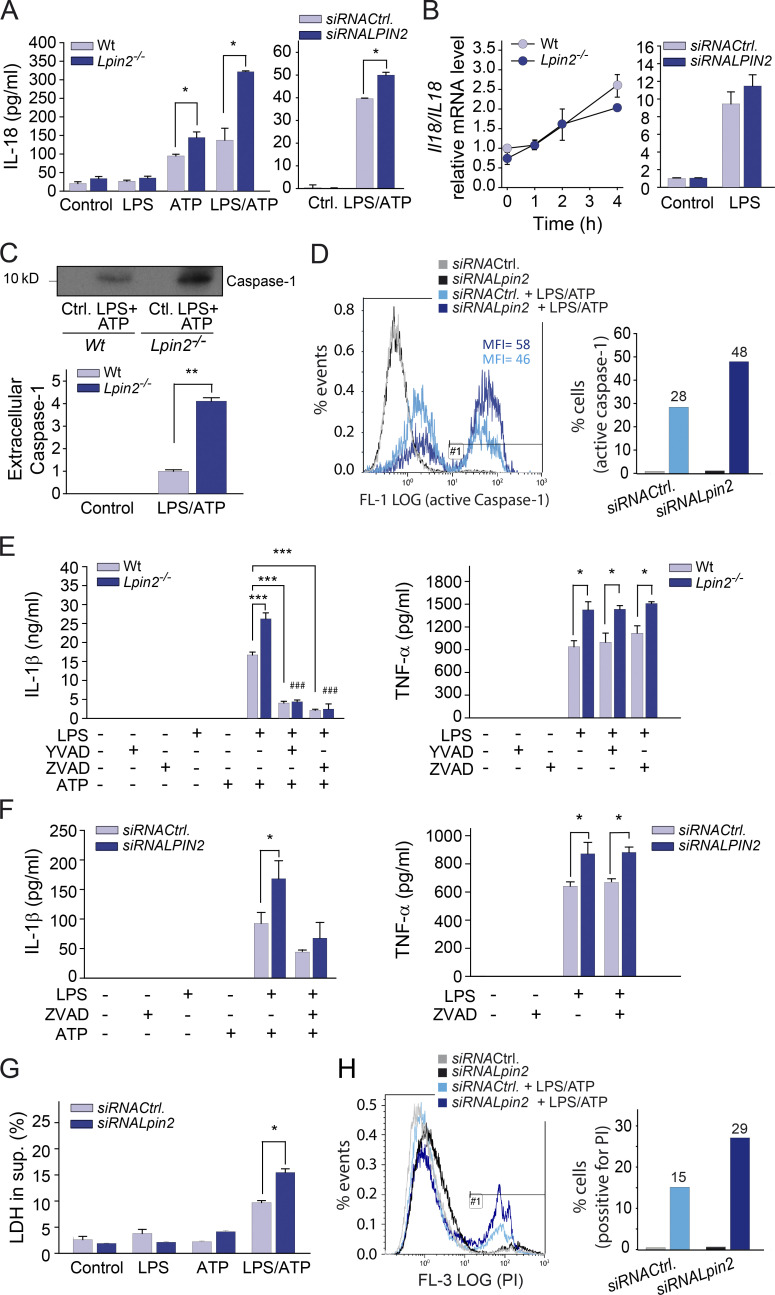
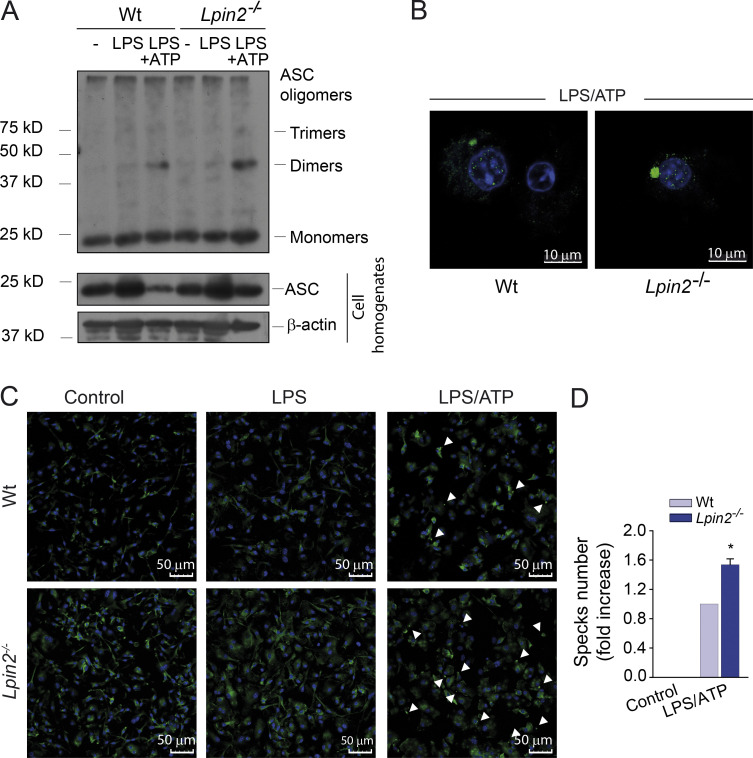
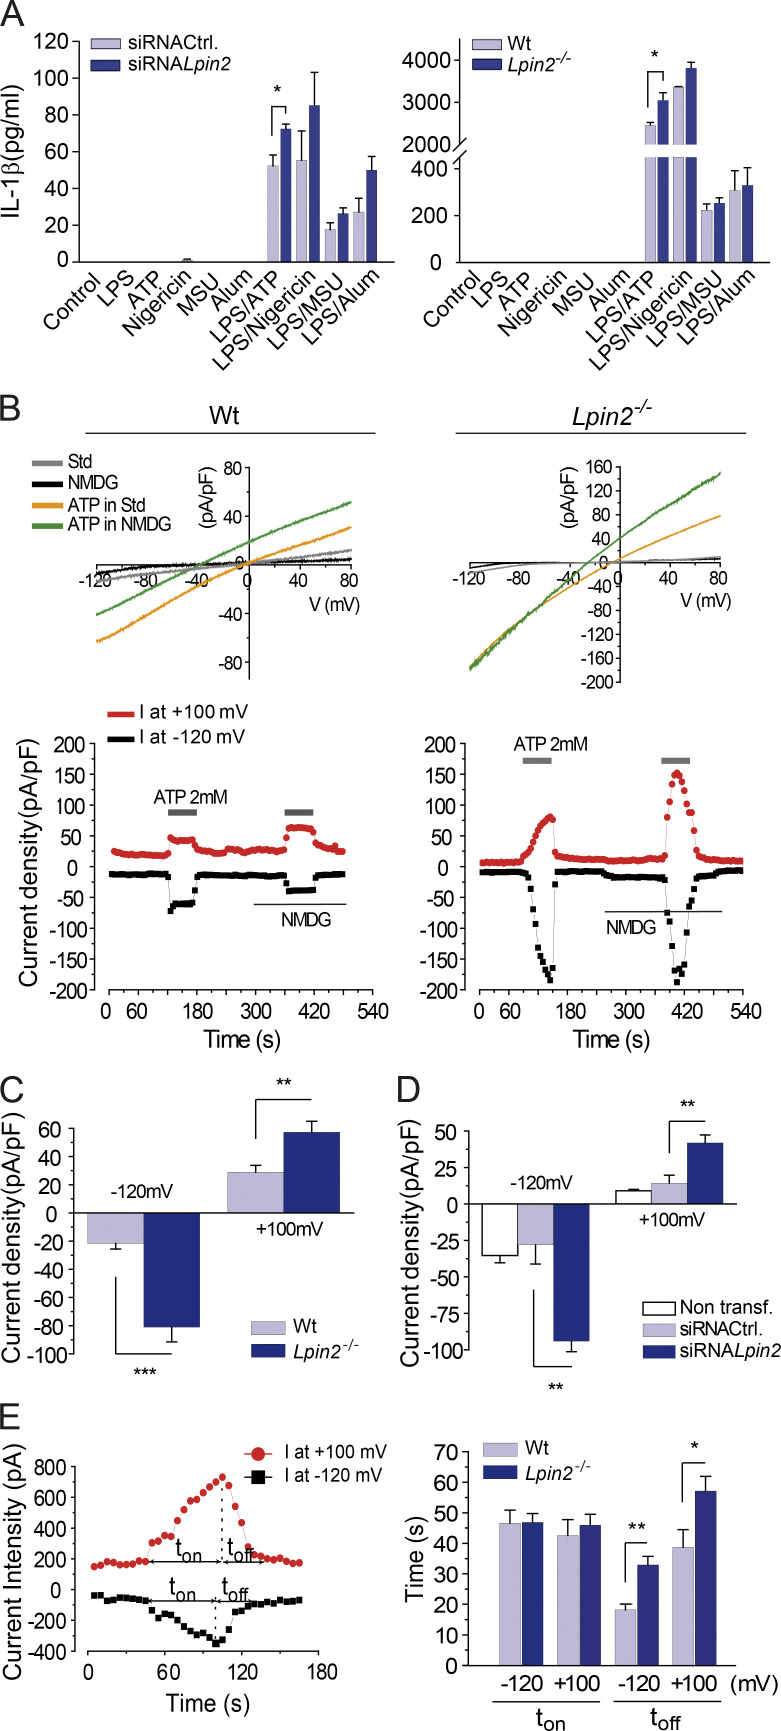
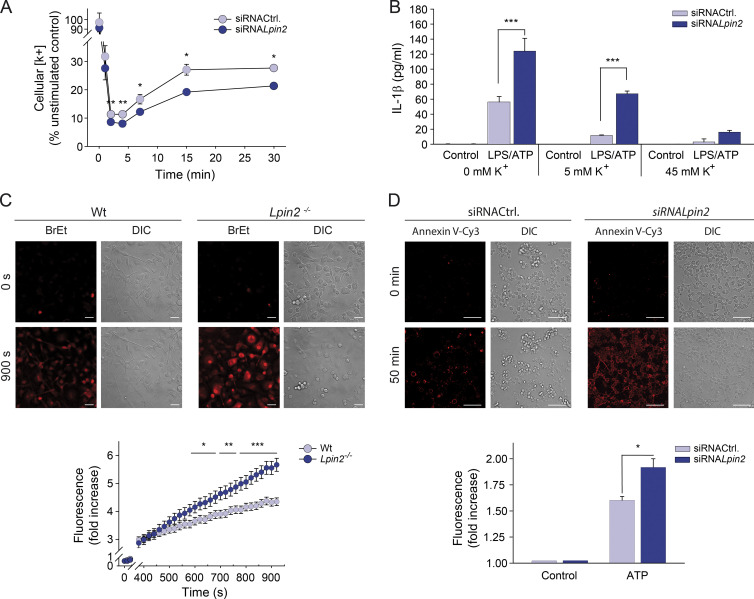
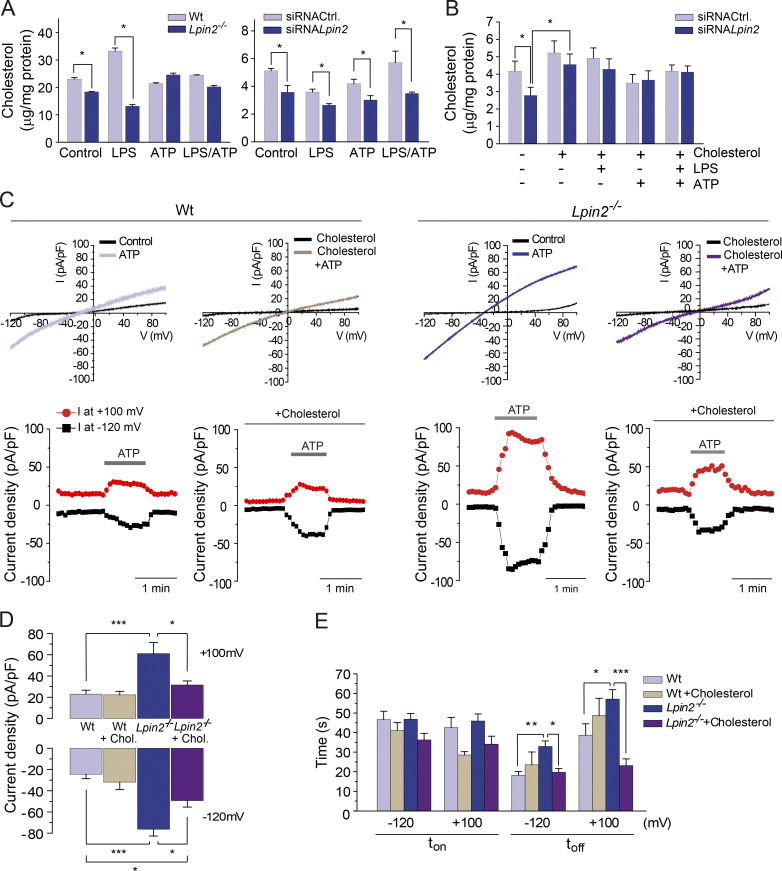
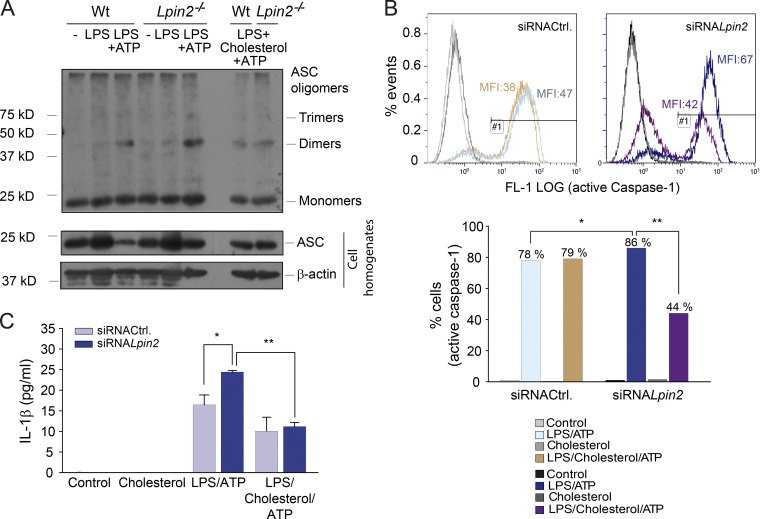
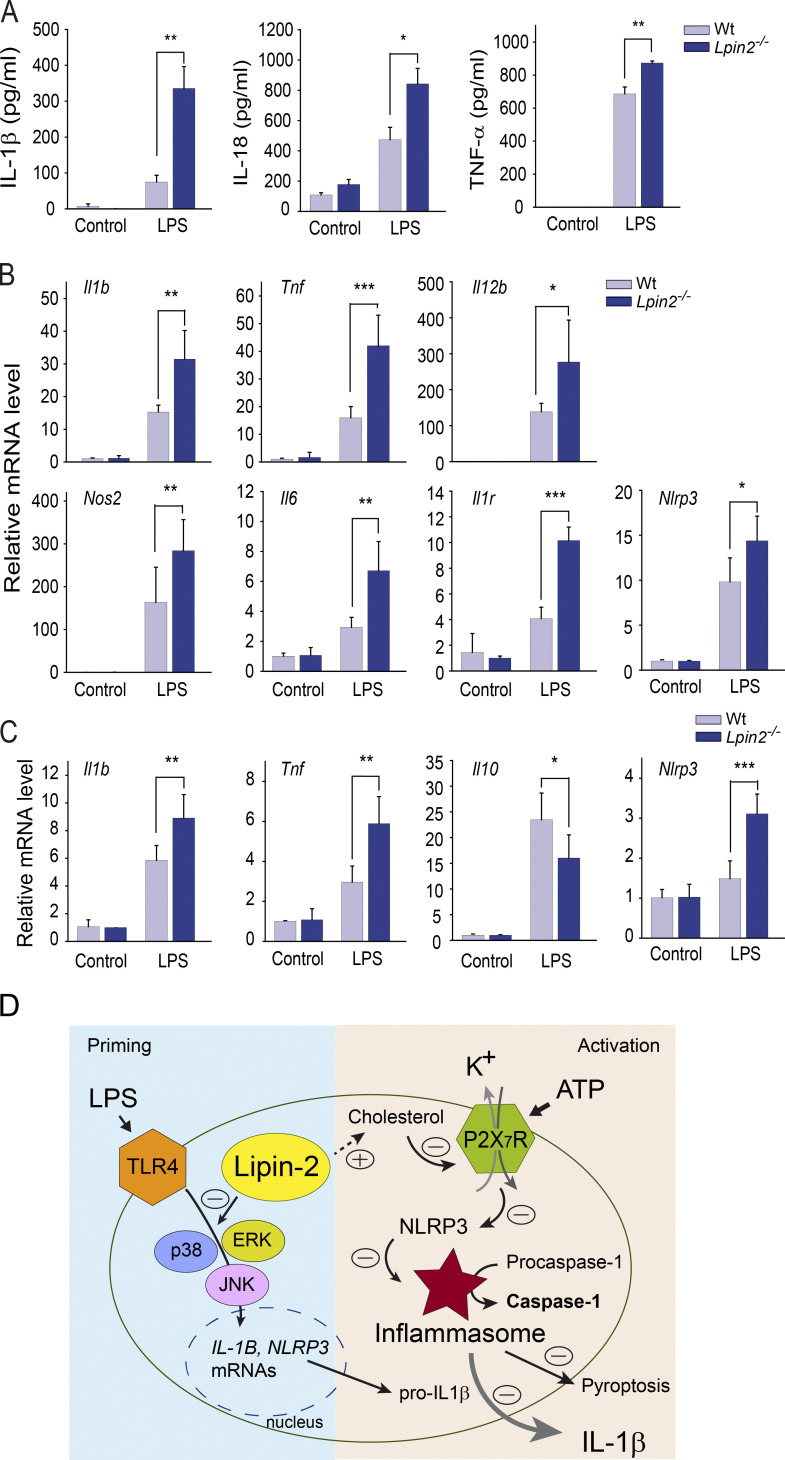
Mutations in human LPIN2 produce a disease known as Majeed syndrome, the clinical manifestations of which are ameliorated by strategies that block IL-1β or its receptor. However the role of lipin-2 during IL-1β production remains elusive. We show here that lipin-2 controls excessive IL-1β formation in primary human and mouse macrophages by several mechanisms, including activation of the inflammasome NLRP3. Lipin-2 regulates MAPK activation, which mediates synthesis of pro-IL-1β during inflammasome priming. Lipin-2 also inhibits the activation and sensitization of the purinergic receptor P2X7 and K+ efflux, apoptosis-associated speck-like protein with a CARD domain oligomerization, and caspase-1 processing, key events during inflammasome activation. Reduced levels of lipin-2 in macrophages lead to a decrease in cellular cholesterol levels. In fact, restoration of cholesterol concentrations in cells lacking lipin-2 decreases ion currents through the P2X7 receptor, and downstream events that drive IL-1β production. Furthermore, lipin-2-deficient mice exhibit increased sensitivity to high lipopolysaccharide doses. Collectively, our results unveil lipin-2 as a critical player in the negative regulation of NLRP3 inflammasome.


Figures

Figure 1.
Figure 1.
The effect of lipin-2 on IL-1β production by murine and human macrophages. IL-1β presence in supernatants from primary human macrophages (A), BMDMs from WT and Lpin2−/− mice (B and D), or RAW264.7 cells (C) stimulated with 200 ng/ml LPS for 4 h, 2 mM ATP for 40 min, or both, as indicated, were quantified by specific ELISAs. (A–C) Human macrophages and RAW264.7 cells were silenced as described in Materials and methods, using control (siRNACtrl.) and lipin-2–specific siRNAs (siRNALpin2). (right) Lpin2 mRNA levels at the time of stimulation. (D) BMDMs supernatants were analyzed by immunoblot using specific antibodies against IL-1β. (right) Densitometric quantification of the bands. (E) IL-1β production was analyzed in BMDMs supernatants from WT, Nlrp3−/−, Asc−/−, and Casp1−/− animals treated with a control siRNA (siRNACtrl.) or siRNAs against Lpin2 (siRNALpin2) for 2 d, and then stimulated as indicated. (right) Level of Lpin2 mRNA after silencing. Data from A–C and E are shown as means ± SD and are representative of at least three independent experiments made in triplicate. Data from D are representative of at least three independent experiments. *, P < 0.05; **, P < 0.01; ***, P < 0.001, Student’s t test.
Figure 2.
Figure 2.
The effect of lipin-2 on TLR4 signaling. (A) WT and Lpin2−/− BMDMs were stimulated with 200 ng/ml LPS for the indicated periods of time, and then mRNA levels for Tnf were quantified by RT-qPCR. (B) Quantification of TNF present in cellular supernatants from WT and Lpin2−/− BMDMs (left) or silenced human macrophages (right) treated with 200 ng/ml LPS for 4 h. (C) Quantification of Il1b mRNA levels from WT and Lpin2−/− BMDMs (left), or silenced human macrophages (right) stimulated with LPS. (D) Analysis by Immunoblot of pro–IL-1β present in homogenates from BMDMs (left). (right) Relative expression levels of IL-1β against β-actin. (E) Analysis by immunoblot of MAPKs and their phosphorylated forms present in BMDMs activated as in A (left). (right) Relative quantification of phosphoproteins against total proteins. (F) Control (siRNACtrl.) and lipin-2–silenced (siRNALpin2) RAW264.7 cells were pretreated with 10 µM PD98059, SP600125, or SB203580 for 30 min, and then stimulated with 200 ng/ml LPS for 4 h. Il1b mRNA levels were quantified by RT-qPCR. (G) WT and Lpin2−/− BMDMs were treated with inhibitors before or after stimulation with LPS. Stimulations were as indicated. IL-1β present in cellular supernatants is shown. (H) WT and Lpin2−/− BMDMs were stimulated with LPS as in A, and then Nlrp3 mRNA levels were quantified. (I) Analysis by immunoblot of NLRP3 present in cellular homogenates from BMDMs stimulated as in A (left). (right) Relative NLRP3 expression levels against β actin. β-Actin bands are the same as shown in E because the same blot was used. Data from A–C and F–H are shown as mean ± SD, and experiments shown are representative of at least three independent experiments made in triplicate. Data from D, E, and I are representative of at least three independent experiments. *, P < 0.05; **, P < 0.01; ***, P < 0.001, Student’s t test. #, P < 0.05; ###, P < 0.001, versus siRNALpin2 + LPS cells (F), or Lpin2−/− + LPS/ATP cells (G) by Student’s t test.
Figure 3.
Figure 3.
The effect of lipin-2 on caspase-1 activation. (A) WT and Lpin2−/− BMDMs (left) or silenced human macrophages (right) were stimulated with 200 ng/ml LPS for 4 h or the indicated periods of time, 2 mM ATP for 40 min, or both, as indicated. IL-18 present in cellular supernatants was quantified by specific ELISAs. (B) Cells as in A were stimulated with LPS and Il18 mRNA levels were quantified by RT-qPCR. (C) Analysis by immunoblot of active caspase-1 present in supernatants from WT and Lpin2−/− BMDMs (top). (bottom) Densitometric quantification of the bands. (D) Analysis of intracellular active caspase by flow cytometry in RAW264.7 cells treated with control siRNA (siRNACtrl.) or siRNA against lipin-2 (siRNALpin2) and stimulated as in A. Median fluorescence intensities (MFI) are indicated (left). (right) Percentage of cells with active caspase-1. (E and F) WT and Lpin2−/− BMDMs (E) or silenced human macrophages (F) were pretreated with 10 µM YVAD or ZVAD for 30 min and then stimulated as in A. (G) IL-1β (left) and TNF (right) present in cellular supernatants were quantified by specific ELISAs. LDH release from RAW264.7 cells treated as in D. (H) Analysis by flow cytometry of RAW264.7 cells treated as in D and stained with propidium iodide (PI; left). (right) Percentage of cells positive for PI. Data from A, B, and E–G are shown as mean ± SD, and experiments shown are representative of at least three independent experiments made in triplicate. Data from C, D, and H are representative of at least three independent experiments. *, P < 0.05; **, P < 0.01; ***, P < 0.001, Student’s t test. (E) ###, P < 0.001, versus Lpin2−/− + LPS/ATP cells by Student’s t test.
Figure 4.
Figure 4.
The effect of lipin-2 on ASC oligomerization and inflammasome assembly. BMDMs from WT and Lpin2−/− mice (A–D) were treated with 200 ng/ml LPS for 4 h, 2 mM ATP for 40 min, or both, as indicated. (A) Proteins from whole-cell lysates and purified cross-linked ASC oligomers were analyzed by immunoblot using specific antibodies against ASC or β-actin as a loading control. (B and C) Cells were stimulated as indicated and stained with specific antibodies against ASC and DAPI, as mentioned in the Materials and methods. Fluorescence was imaged by confocal microscopy. Bars: (B) 10 µm; (C) 50 µm. Arrowheads denote ASC specks. (D) Fold increase in ASC speck production from 700–1,400 cells is shown. Data from A–D are representative of at least three independent experiments. Data from D are shown as means ± SD *, P < 0.05, Student’s t test.
Figure 5.
Figure 5.
The effect of Lipin-2 on cellular ionic currents generated by ATP. RAW264.7 cells treated with control siRNA (siRNACtrl.), siRNA against lipin-2 (siRNALpin2; A, left), or BMDMs from WT and Lpin2−/− mice (A, right) were stimulated with 100 ng/ml LPS for 4 h, 2 mM ATP or 10 µM nigericin for 40 min, 200 µg/ml monosodium urate (MSU) or 150 µg/ml alum for 6 h, or LPS for 4 h, followed by ATP or nigericin for 40 min, MSU, or alum for 6 h, as indicated. IL-1β present in cellular supernatants was analyzed by specific ELISA (A). (B) Representative traces obtained with whole-cell recordings using a 1-s ramp protocol in peritoneal macrophages from WT and Lpin2−/− animals stimulated with 2 mM ATP in control solution (140 mM NaCl) or in a solution where NaCl has been substituted for 140 mM N-methyl-d-glucamine (NMDG), as indicated. (top) Current density versus voltage plots; (bottom) time course of the current density at −120 and +100 mV. (C) Mean current density from 25–39 macrophages analyzed is shown. RAW264.7 cells were also evaluated as in B and mean current density from 18 cells is shown (D). Time course of the current amplitude obtained at −120 mV and +100 mV in a peritoneal macrophage from WT mice upon exposure to 2 mM ATP during the indicated time, to illustrate the calculations of ton (time from opening to maximal stimulation) and toff (time from maximal opening to closure; E, left). (right) Mean ton and toff for −120 mV and +100 mV from WT and Lpin2−/− mice peritoneal macrophages (14–40 cells) stimulated with 2 mM ATP (E). Data from A are shown as mean ± SD, and experiments shown are representative of at least three independent ones made in triplicate. *, P < 0.05, Student’s t test. Dada from C, D, and E, are shown as means ± SEM *, P < 0.05; **, P < 0.01; ***, P < 0.001, one-way ANOVA, followed by Tukey's test.
Figure 6.
Figure 6.
Effect of lipin-2 on ATP-induced changes in K+ cellular levels and cell permeability. (A) Control (siRNACtrl.) and lipin-2–silenced (siRNALpin2) RAW264.7 cells were stimulated with 2 mM ATP for the indicated periods of time, and intracellular concentration of K+ was analyzed using an inductively coupled plasma/optical emission spectrometer. (B) RAW264.7 cells were stimulated with 200 ng/ml LPS for 4 h, and then 2 mM ATP for 40 min, as indicated, in the presence of 0, 5, or 45 mM K+. IL-1β present in cellular supernatants was analyzed by specific ELISAS. (C) BMDMs from WT and Lpin2−/− mice were pretreated with 20 µM ethidium bromide (BrEt) for 5 min, and then stimulated with 2 mM ATP. Ethidium cellular uptake was monitored by confocal microscopy. (top) Cell fluorescence; (bottom) fluorescence fold increase over time. Bar, 25 µm. (D) Control (siRNACtrl.) and lipin-2–silenced (siRNALpin2) RAW264.7 cells were stimulated with 2 mM ATP for 50 min in the presence of Annexin-V-Cy3, and fluorescence analyzed in a confocal microscope (top). (bottom) Fluorescence fold increase over unstimulated cells. Bar, 50 µm. Data from A and B are shown as mean ± SD, and experiments shown are representative of at least three independent experiments made in triplicates. Data from C (>100 cells) and D (>300 cells) are shown as means ± SEM, and experiments shown are representative of at least three independent ones. *, P < 0.05; **, P < 0.01; ***, P < 0.001, by Student’s t test.
Figure 7.
Figure 7.
Impact of lipin-2 on cellular cholesterol levels, and restoration of P2X7R functionality by cholesterol in the absence of lipin-2. (A) BMDMs from WT and Lpin2−/− mice (left), or control (siRNACtrl.) and lipin-2–silenced (siRNALpin2) RAW264.7 cells (right) were treated with 200 ng/ml LPS for 4 h, 2 mM ATP for 40 min, or both, as indicated. (B) Total cellular cholesterol levels were analyzed as described in Materials and methods. RAW264.7 cells preincubated with 100 µg/ml cholesterol (cholesterol/MCD) for 30 min were treated as in A, and total cellular cholesterol levels were measured. (C) Example traces of whole-cell ionic currents analyzed by patch-clamp in peritoneal macrophages from WT and Lpin2−/− animals stimulated with 2 mM ATP in the absence or presence of 100 µg/ml cholesterol (cholesterol/MCD) as indicated. (top) Current density against voltage; (bottom) current densities at −120 and +100 mV. (D) Mean current density from 15–18 cells analyzed. (E) The mean ton and toff at −120 and +100 mV from WT and Lpin2−/− mice peritoneal macrophages stimulated with 2 mM ATP in the presence or absence of 100 µg/ml cholesterol (cholesterol/MCD). Data from A and B are shown as mean ± SD, and experiments shown are representative of at least three independent experiments made in triplicate. Data from D and E are shown as means ± SEM *, P < 0.05; **, P < 0.01; ***, P < 0.001, Student’s t test (A and B) or by one-way ANOVA followed by Tukey's test (D and E).
Figure 8.
Figure 8.
Cholesterol effect on ASC oligomerization, capase-1 activation, and IL-1β production in the absence of lipin-2. (A) BMDMs from WT and Lpin2−/− mice were treated with 200 ng/ml LPS for 4 h, 2 mM ATP, or both, as indicated. Some samples were preincubated with 100 µg/ml cholesterol 30 min before ATP treatment, as indicated. Proteins from whole-cell lysates and purified cross-linked ASC oligomers were analyzed by immunoblot using specific antibodies against ASC or β-actin, as a loading control. (B) Control (siRNACtrl.) or lipin-2–silenced (siRNALpin2) RAW264.7 cells were treated with 200 ng/ml LPS for 4 h and then 2 mM ATP for 40 min, as indicated. Some samples were preincubated with 100 µg/ml cholesterol (cholesterol/MCD) 30 min before ATP treatment, as indicated. Intracellular active caspase was analyzed by flow cytometry as specified in Materials and methods. Median fluorescence intensities (MFI) are indicated. (bottom) Percentage of cells with active caspase-1. (C) RAW264.7 cells were treated as in B and presence of IL-1β in cellular supernatants was quantified by specific ELISA in triplicate samples. Data are shown as means ± SD, and experiments shown are representative of at least three independent experiments. *, P < 0.05; **, P < 0.01, by Student’s t test.
Figure 9.
Figure 9.
The effect of lipin-2 in the response to LPS in mice. (A) WT and Lpin2−/− mice (n = 5) were intraperitoneally injected with 10 mg/kg of LPS or PBS. 3 h later, indicated cytokines were quantified in serum using specific ELISA. Expression levels of the indicated genes were analyzed in liver (B) or spleen (C) by RT-qPCR. (D) Proposed scheme depicting lipin-2 effects on priming and activation of the inflammasome. Data are shown as means ± SD, and experiments shown are representative of at least two independent ones analyzed in triplicates. *, P < 0.05; **, P < 0.01; ***, P < 0.001, by Student’s t test.

References

    1. Al-Mosawi, Z.S., Al-Saad K.K., Ijadi-Maghsoodi R., El-Shanti H.I., and Ferguson P.J.. 2007. A splice site mutation confirms the role of LPIN2 in Majeed syndrome. Arthritis Rheum. 56:960–964. 10.1002/art.22431 - DOI - PubMed
    1. Baldassare, J.J., Bi Y., and Bellone C.J.. 1999. The role of p38 mitogen-activated protein kinase in IL-1 β transcription. J. Immunol. 162:5367–5373. - PubMed
    1. Bartlett, R., Stokes L., and Sluyter R.. 2014. The P2X7 receptor channel: recent developments and the use of P2X7 antagonists in models of disease. Pharmacol. Rev. 66:638–675. 10.1124/pr.113.008003 - DOI - PubMed
    1. Basak, C., Pathak S.K., Bhattacharyya A., Mandal D., Pathak S., and Kundu M.. 2005. NF-κB- and C/EBPβ-driven interleukin-1β gene expression and PAK1-mediated caspase-1 activation play essential roles in interleukin-1β release from Helicobacter pylori lipopolysaccharide-stimulated macrophages. J. Biol. Chem. 280:4279–4288. 10.1074/jbc.M412820200 - DOI - PubMed
    1. Bauernfeind, F.G., Horvath G., Stutz A., Alnemri E.S., MacDonald K., Speert D., Fernandes-Alnemri T., Wu J., Monks B.G., Fitzgerald K.A., et al. . 2009. Cutting edge: NF-kappaB activating pattern recognition and cytokine receptors license NLRP3 inflammasome activation by regulating NLRP3 expression. J. Immunol. 183:787–791. 10.4049/jimmunol.0901363 - DOI - PMC - PubMed

Publication types

MeSH terms