. 2017 Jan 17;114(3):E327-E336.
doi: 10.1073/pnas.1619052114. Epub 2016 Dec 28.

Comprehensive population-based genome sequencing provides insight into hematopoietic regulatory mechanisms

Affiliations

Comprehensive population-based genome sequencing provides insight into hematopoietic regulatory mechanisms

Michael H Guo et al. Proc Natl Acad Sci U S A. .

Abstract

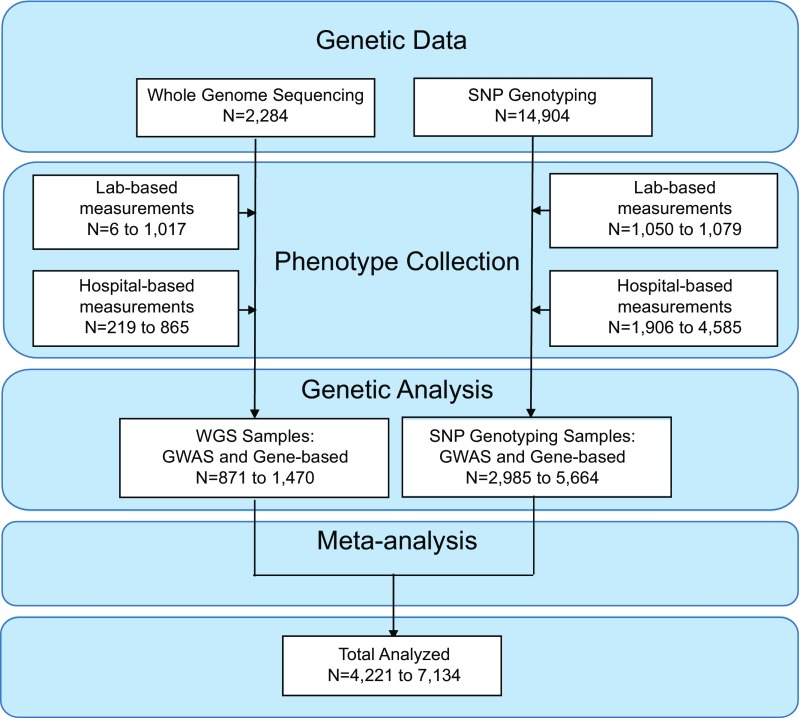
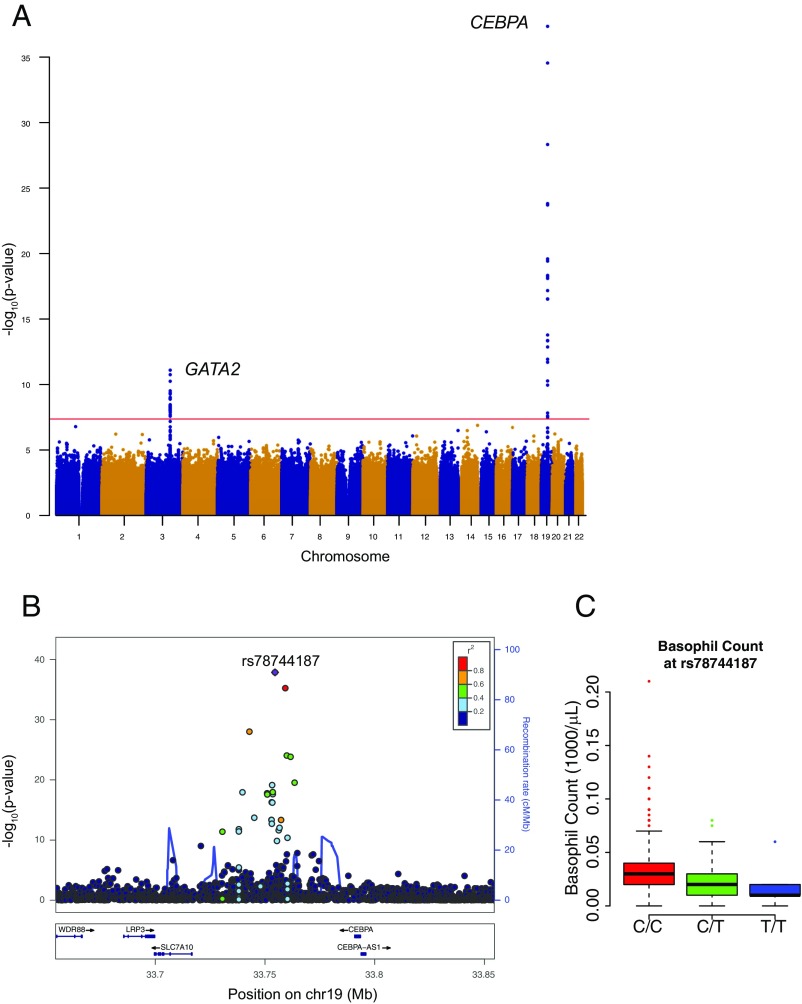
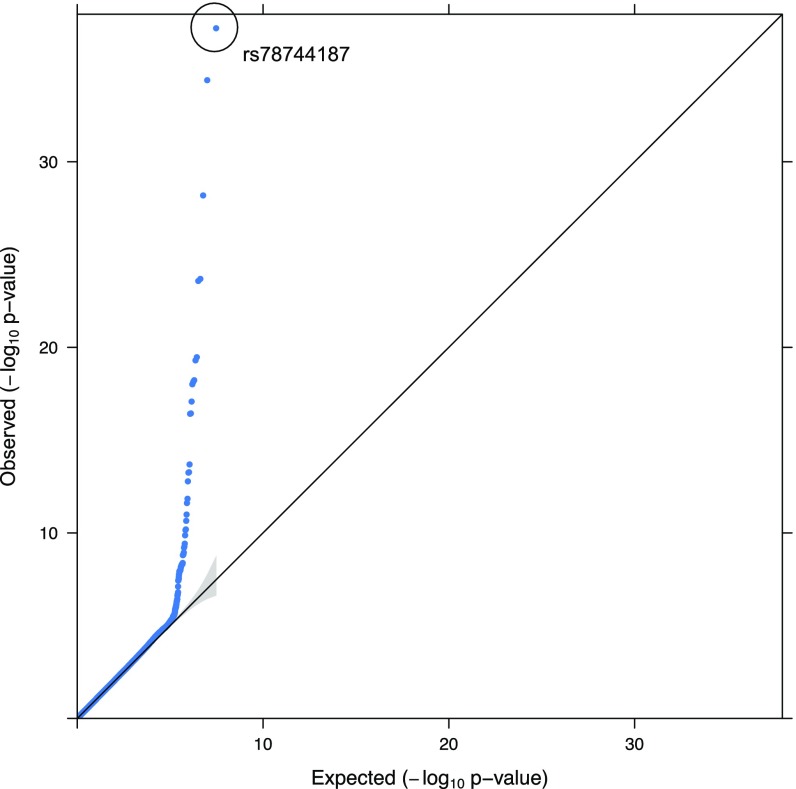
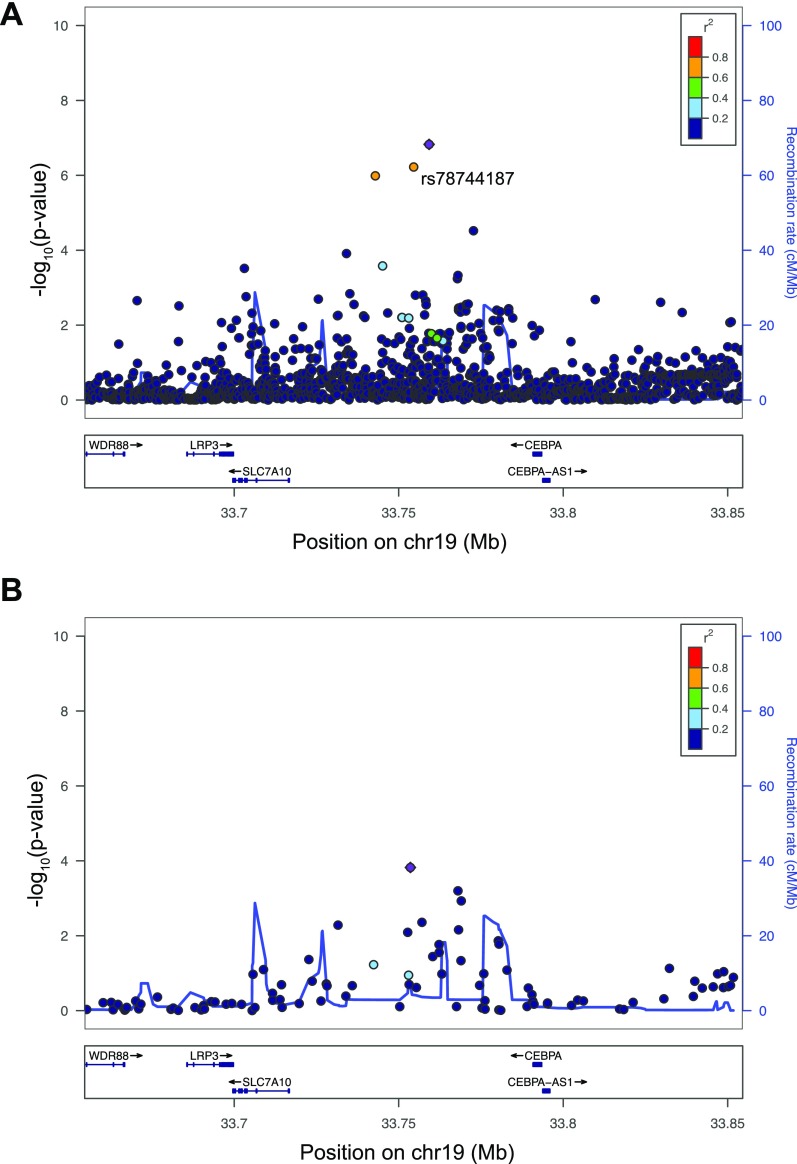
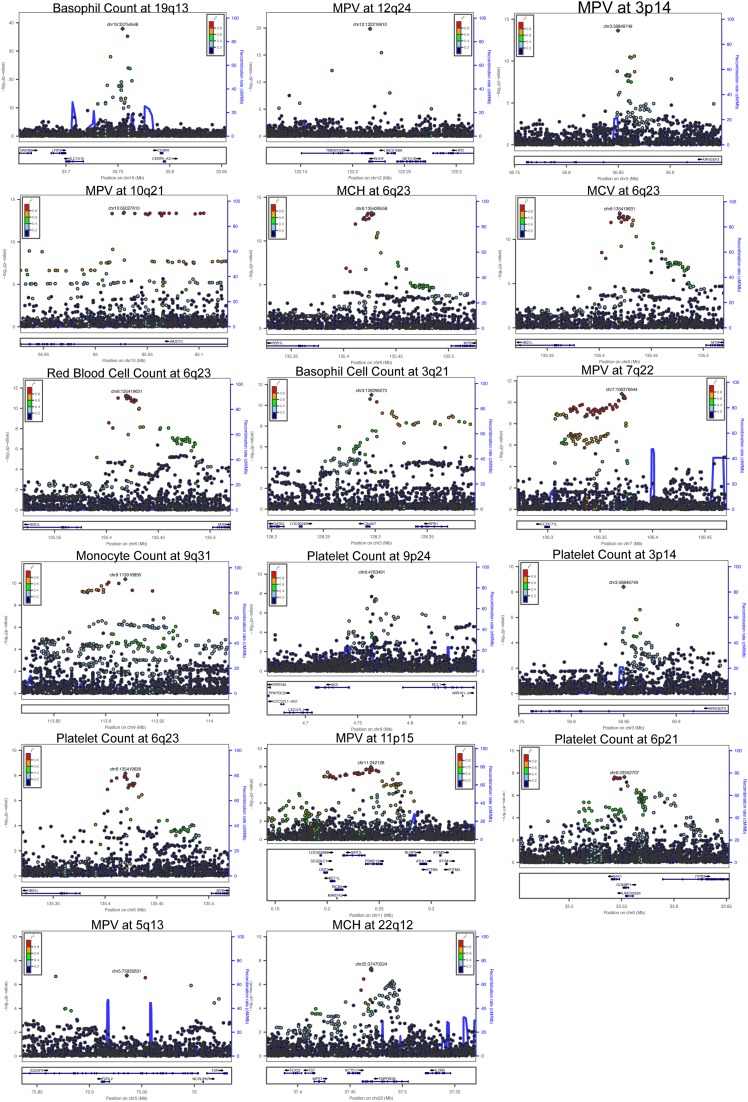
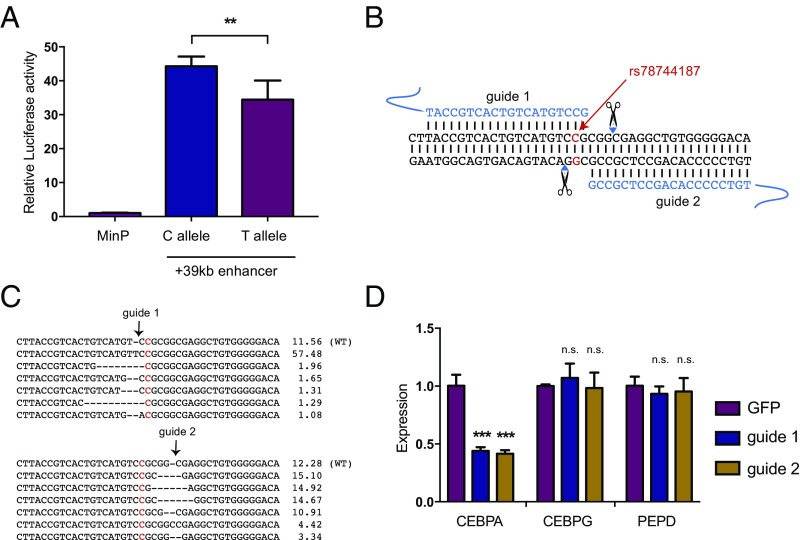
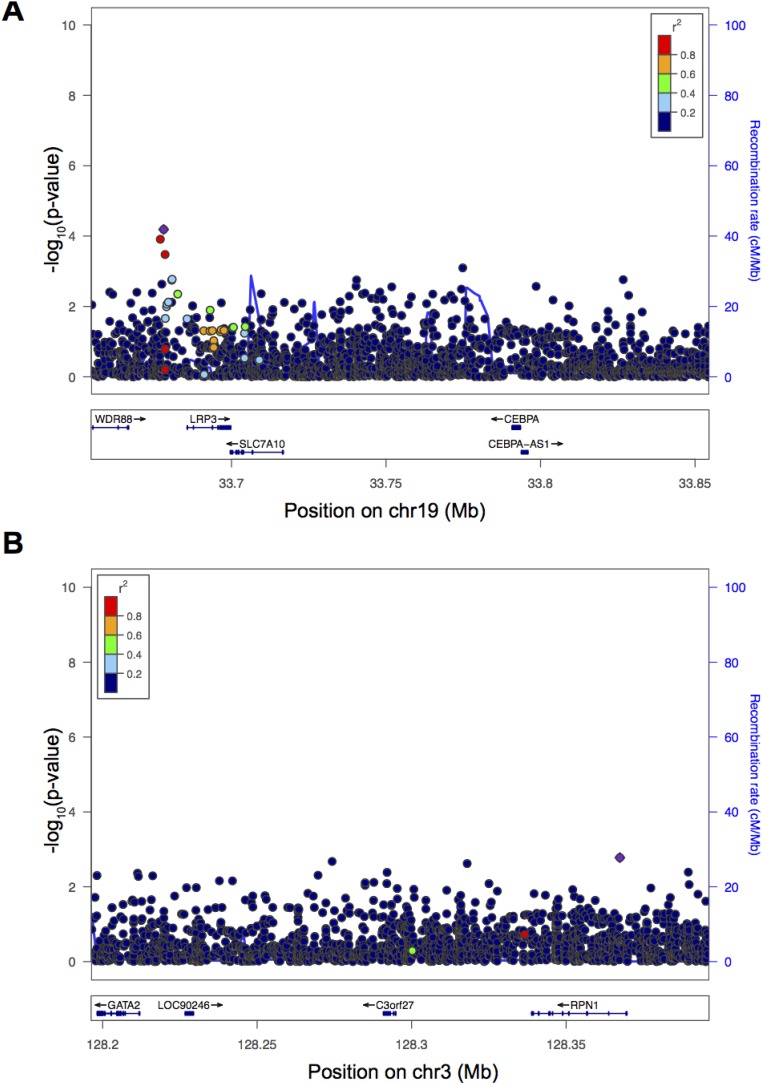
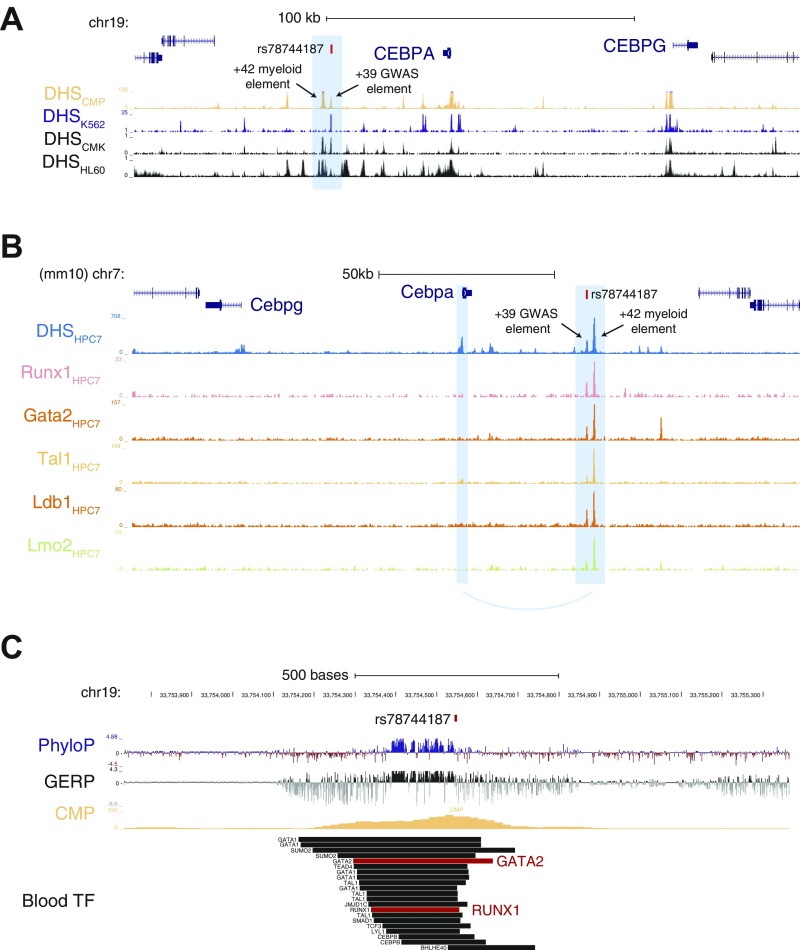
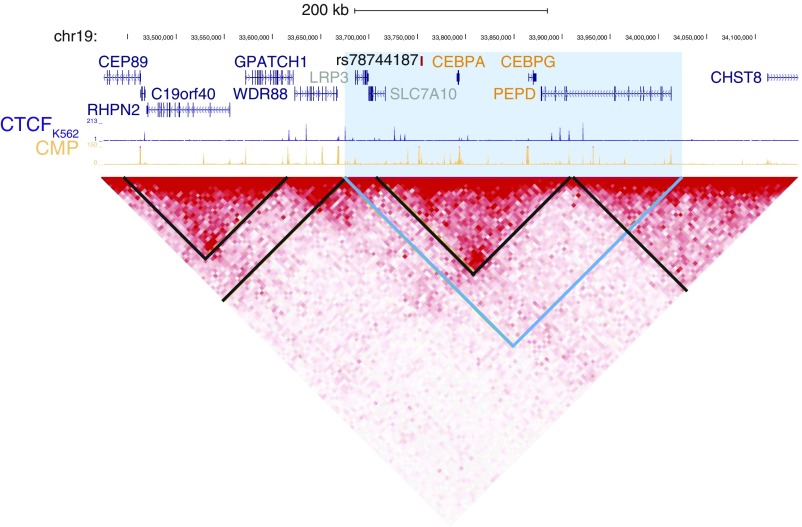
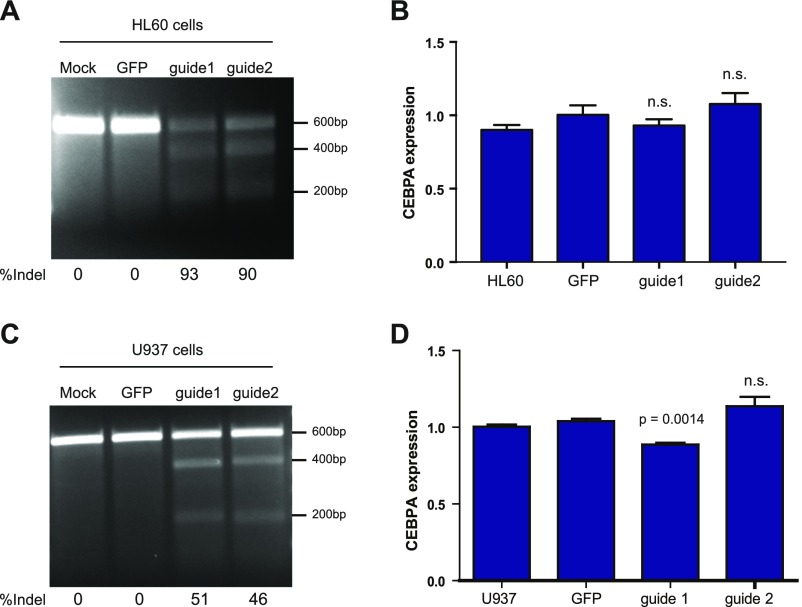
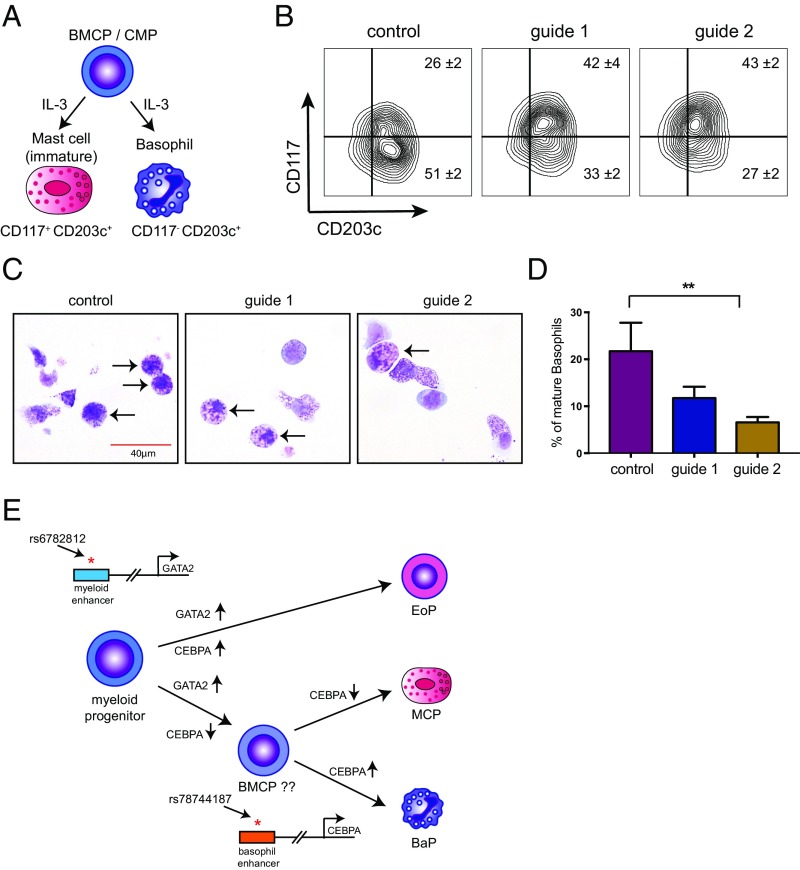
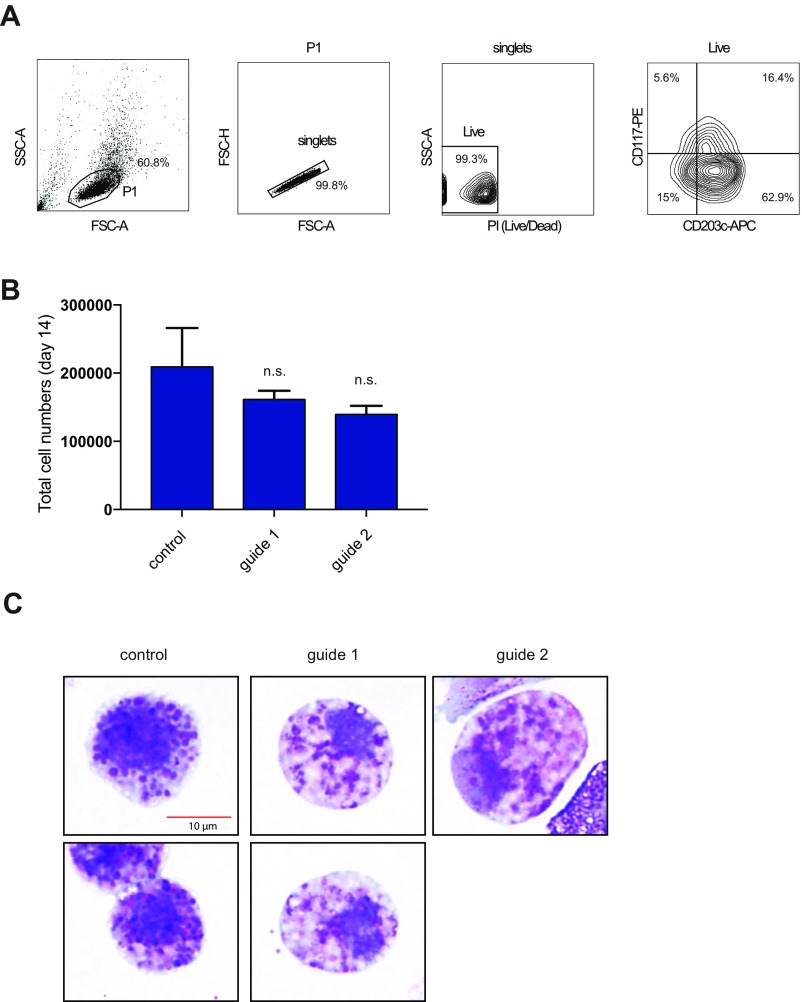
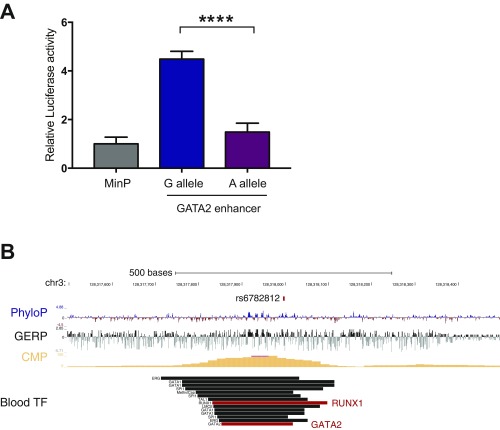
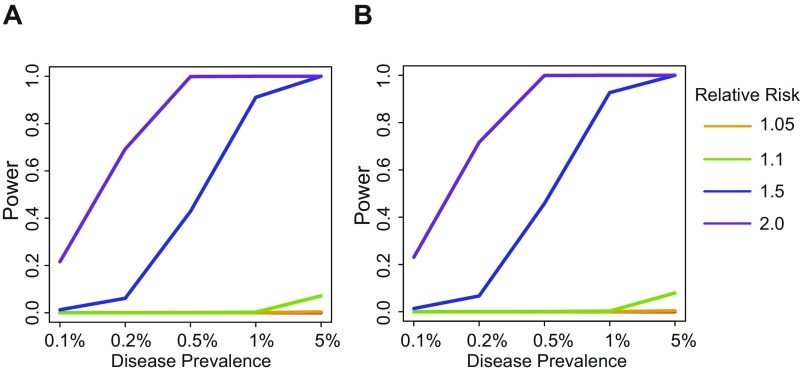
Genetic variants affecting hematopoiesis can influence commonly measured blood cell traits. To identify factors that affect hematopoiesis, we performed association studies for blood cell traits in the population-based Estonian Biobank using high-coverage whole-genome sequencing (WGS) in 2,284 samples and SNP genotyping in an additional 14,904 samples. Using up to 7,134 samples with available phenotype data, our analyses identified 17 associations across 14 blood cell traits. Integration of WGS-based fine-mapping and complementary epigenomic datasets provided evidence for causal mechanisms at several loci, including at a previously undiscovered basophil count-associated locus near the master hematopoietic transcription factor CEBPA The fine-mapped variant at this basophil count association near CEBPA overlapped an enhancer active in common myeloid progenitors and influenced its activity. In situ perturbation of this enhancer by CRISPR/Cas9 mutagenesis in hematopoietic stem and progenitor cells demonstrated that it is necessary for and specifically regulates CEBPA expression during basophil differentiation. We additionally identified basophil count-associated variation at another more pleiotropic myeloid enhancer near GATA2, highlighting regulatory mechanisms for ordered expression of master hematopoietic regulators during lineage specification. Our study illustrates how population-based genetic studies can provide key insights into poorly understood cell differentiation processes of considerable physiologic relevance.

Keywords: CEBPA; GWAS; basophils; genome sequencing; hematopoiesis.


Conflict of interest statement

The authors declare no conflict of interest.

Figures

Fig. S1.
Fig. S1.
Flow diagram for genetic studies.
Fig. S2.
Fig. S2.
Pairwise correlations of each of the 14 traits. Correlation r2 values are shown in the grid.
Fig. S3.
Fig. S3.
Trait histograms for each blood cell trait. For each blood trait, the distribution of laboratory-based measurements is shown in blue and measurements extracted from EMR records is shown in red.
Fig. S4.
Fig. S4.
Correlations of laboratory-based measurements (x axis) with EMR-based records (y axis) based on individuals with data from both sources.
Fig. 1.
Fig. 1.
Basophil count association near CEBPA. (A) Manhattan plot for single-variant association study for basophil counts. Genome-wide significant associations near GATA2 and CEBPA are marked. (B) Locuszoom plot shows association strength, LD, and recombination event frequency. (C) Basophil counts by genotype of rs78744187.
Fig. S5.
Fig. S5.
Quantile–quantile (QQ) plot for basophil count association. The lead SNP (rs78744187) near CEBPA is marked. The 95% confidence interval is shown as a gray band.
Fig. S6.
Fig. S6.
Replication of rs78744187 association in dbGaP cohorts. (A) Locuszoom plot of basophil count in three US-based dbGaP cohorts when imputed to 1000 Genomes phase 1. (B) Locuszoom plot of basophil count in the same three US-based dbGaP cohorts when imputed to HapMap phase 3.
Fig. S7.
Fig. S7.
Locuszoom plots showing association signals performed using the pre-QC Estonian WGS as an imputation panel.
Fig. S8.
Fig. S8.
Venn diagrams comparing fine-mapping procedures are shown for the overlap of variants in 97.5% CSs derived using ABF, CaviarBF, and PICS.
Fig. 2.
Fig. 2.
Integration of ATAC-seq data with fine-mapping results sheds mechanistic insights. (A) CS variants that overlap with NDRs in the 13 hematopoietic cell types are shown. Quantile-normalized read counts per million were min-max scaled for each row. Based upon manual investigation, variants that overlapped with a NDR that was not within the top 20% of NDRs for at least 1 of the 13 cell types were excluded. Variants that fall within lineage-specific NDRs of clear relevance to their associated phenotypes are highlighted with dashed boxes. (B) Eleven of the variants in the combined CS for the HSB1L/MYB locus association with multiple red cell and platelet associations lie within six separate hematopoietic enhancer elements. The three MEP/erythroid-specific elements are shown in green (−84 kb), purple (−83 kb), and red (−71 kb). rs9494145 resides within a weaker −70-kb element and is included in the same highlight as the substantially more nucleosome-depleted −71-kb element.
Fig. S9.
Fig. S9.
Multiple variants in strong LD overlap with erythroid-specific elements at the HBS1L/MYB locus. The −84- and −71-kb elements have previously been identified as harboring putative causal variants, whereas the −83-kb element is a unique putative enhancer element containing three CS variants.
Fig. S10.
Fig. S10.
The finely mapped MPV-associated variant rs1354034 lies within a MEP element. rs1354034, the single variant in the CS for the MPV association at 3p14, is within a CMP/MEP-specific NDR in an intron of the gene ARHGEF3. The variant itself falls within an evolutionarily conserved motif for a GATA factor (TTATCT).
Fig. S11.
Fig. S11.
Functional significance scores by group from the neural net DeepSea model (trained on 919 chromatin features). Mann–Whitney U one-sided test used between CS variants and non-CS variants in moderate to high LD (r2 > 0.5) (*P < 0.05; ***P < 0.0001).
Fig. S12.
Fig. S12.
rs1354034 is occupied by Gata1 in megakaryocytes and disrupts a canonical GATA motif in mice. At the orthologous locus for rs1354034 in mouse, Gata1 occupies its canonical motif in megakaryocytes but not in erythroid cells. rs1354034 disrupts this motif, suggesting a putative mechanism for this fine-mapped variant.
Fig. 3.
Fig. 3.
Overlap of basophil-associated variants with hematopoietic regulatory elements. (A) Overlap of rs78744187 with NDRs in hematopoietic progenitors and their terminal progeny. Conservation across 100 vertebrates (PhyloP) or mammals (GERP) is also shown. A conserved motif element is observed proximal to rs78744187. (B) Similar to A except for rs6782812. Two conserved motif elements can be observed nearby.
Fig. 4.
Fig. 4.
rs78744187 modulates the activity of a CEBPA enhancer. (A) A 400-bp genomic region containing rs78744187 shows allele-specific enhancer activity in K562 cells by luciferase assay (**P < 0.01). (B) Schematic of CRISPR/Cas9 disruption at the +39-kb myeloid enhancer. (C) Mobilized peripheral blood CD34+ cells were infected with lentiviral CRISPR/Cas9 constructs. Indel frequency was measured at day 14 by deep sequencing, and the top six indels are shown. (D) Expression of transcribed genes in the TAD containing rs78744187 after enhancer disruption at day 7 (quantitative RT-PCR). Results are reported as mean and SD across three independent experiments (n.s., not significant; ***P < 0.0001).
Fig. S13.
Fig. S13.
Conditional analyses for basophil count-associated loci. (A) Locuszoom plot for basophil counts at 19q13, conditioned on the sentinel SNP rs78744187. (B) Locuszoom plot for basophil counts at 3q21, conditioned on the sentinel SNP rs2465283.
Fig. S14.
Fig. S14.
NDRs and TF occupancy in blood cells for rs78744187. (A) The +39-kb element harboring rs78744187 is an NDR in multiple myeloid cell lines in addition to CMPs. (B) The orthologous +39-kb element in a mouse hematopoietic progenitor cell line is clearly defined and is occupied by key myeloid TFs such as GATA2 and RUNX1. (C) Within the +39-kb element, rs78744187 is also occupied by GATA2 and RUNX1 in human blood cells.
Fig. S15.
Fig. S15.
TAD containing rs78744187. Interaction frequency based upon Hi-C for K562 cells is shown as a triangular heat map. Contact domain boundaries are shown in black. The blue triangle contains the full gene bodies of all genes within or at the border of the contact domain containing rs78744187. Within this region, expressed genes, based upon qRT-PCR in primary cell culture, are in orange, whereas lowly expressed genes are in gray.
Fig. S16.
Fig. S16.
The +39-kb enhancer does not regulate CEBPA expression in granulocyte/monocyte cell lines. (A and C) Efficient CRISPR/Cas9-mediated disruption of the +39-kb enhancer at day 12 postinfection in bulk HL60 and U937 cells as demonstrated by Surveyor assay. (B and D) CEBPA expression at day 12 postinfection in bulk HL60 and U937 cells measured by qRT-PCR.
Fig. 5.
Fig. 5.
An intact +39-kb CEBPA enhancer is required for human basophil differentiation. (A) IL-3–mediated differentiation of primary human CD34+ cells generates both basophils and mast cells from a myeloid progenitor that may either be a basophil/mast cell progenitor (BMCP) and/or derivative of the common myeloid progenitor (CMP) population. (B) FACS analysis shows impaired differentiation of basophils and a concomitant increase in mast cells after +39-kb enhancer disruption (mean ± SD of three independent experiments). (C) Representative images of May–Giemsa stains at day 14. Arrows indicate fully differentiated, mature basophils in the left panel, whereas the arrows indicate cells with abnormal basophilic and some eosinophilic granules in the +39-kb enhancer-disrupted cultures. (D) Impaired maturation of basophils based upon morphology in May–Grünwald Giemsa stains. Student’s t test performed between control vs. both guides (**P < 0.01). (E) Previous studies have shown that ordered expression of GATA2 and CEBPA is critical for differentiation of eosinophils, basophils, and mast cells. Our GWAS follow-up study has identified enhancers that, at least partially, mediate this ordered expression pattern. Up-regulation of GATA2 is required for all three lineages. Accordingly, the rs6782812 variant in the GATA2 locus is associated with both eosinophil and basophil counts. Up-regulation of CEBPA is required only for basophil differentiation from BMCPs and/or CMPs. Accordingly, the rs78744187 variant in the CEBPA locus is associated with basophil counts and affects basophil differentiation. BMCP, basophil/mast cell progenitor; BaP, basophil progenitor; EoP, eosinophil progenitor; MCP, mast cell progenitor.
Fig. S17.
Fig. S17.
The +39-kb enhancer disruption does not affect cell proliferation during basophil/mast cell differentiation from human CD34+ cells. (A) Flow gating strategy used to quantify mast cells and basophils. (B) Total cell numbers at day 14 of human CD34+ cells culture in IL-3. (C) Representative zoomed-in images of single basophils from different conditions in Fig. 5C.
Fig. S18.
Fig. S18.
The fine-mapped variant at GATA2 is located in an enhancer element and is occupied by multiple myeloid TFs. (A) A 364-bp genomic region containing the basophil count-associated variant within the GATA2 locus (rs6782812) shows allele-specific enhancer activity in K562 cells by luciferase assay (****P < 0.0001). (B) The basophil count-associated variant within the GATA2 locus (rs6782812) lies within a CMP-specific element occupied by GATA2 and RUNX1. Similar to rs78744187 within the +39-kb CEBPA element shown in Fig. S11C.
Fig. S19.
Fig. S19.
Power to detect pheWAS disease associations for rs78744187 (A) and rs2465283 (B). Power calculations were performed at disease prevalence of 0.1, 0.2, 0.5, 1.0, and 5.0%. Disease relative risk were set at 1.01, 1.05, 1.1, 1.5, and 2.0.

References

    1. Sankaran VG, Orkin SH. Genome-wide association studies of hematologic phenotypes: A window into human hematopoiesis. Curr Opin Genet Dev. 2013;23(3):339–344. - PMC - PubMed
    1. Sankaran VG, Weiss MJ. Anemia: Progress in molecular mechanisms and therapies. Nat Med. 2015;21(3):221–230. - PMC - PubMed
    1. van der Harst P, et al. Seventy-five genetic loci influencing the human red blood cell. Nature. 2012;492(7429):369–375. - PMC - PubMed
    1. Ulirsch JC, et al. Systematic functional dissection of common genetic variation affecting red blood cell traits. Cell. 2016;165(6):1530–1545. - PMC - PubMed
    1. Orrù V, et al. Genetic variants regulating immune cell levels in health and disease. Cell. 2013;155(1):242–256. - PMC - PubMed

Publication types

MeSH terms

Substances