Comparative Study
. 2017 Jan 24;8(4):6406-6418.
doi: 10.18632/oncotarget.14115.

Cell-free methylation markers with diagnostic and prognostic potential in hepatocellular carcinoma

Affiliations
Comparative Study

Cell-free methylation markers with diagnostic and prognostic potential in hepatocellular carcinoma

Chang-Yi Lu et al. Oncotarget. .

Abstract

Hepatocellular carcinoma (HCC) is a highly malignant tumor with poor prognosis and high mortality. There is a dearth of effective early diagnostic tools, so liver resection surgery and liver transplantation are the only effective medical treatments. The most commonly used marker for HCC detection is serum alpha fetoprotein (AFP), which has low sensitivity and specificity. Because aberrant DNA methylation of genes and miRNAs occurs early in most cancers, we explored whether circulating methylation markers could be promising clinical tools for HCC diagnosis. Using a whole-genome approach, we identified many hyper-methylated miRNAs in HCC. Furthermore, three abnormally methylated genes and one miRNA were combined to establish a methylation predictive model and tested for its diagnostic and prognostic potential in HCC. Using plasma samples, the predictive model exhibited high sensitivity and specificity (> 80%) for HBV-related HCC. Most importantly, nearly 75% of patients who could not be diagnosed with AFP at 20 ng/mL were detected by this model. Further, the predictive model exhibited an exceedingly high ability to predict 5-year overall survival in HCC patients. These data demonstrate the high diagnostic and prognostic potential of methylation markers in the plasma of HCC patients.

Keywords: DNA methylation; diagnosis; hepatocellular carcinoma; marker; microRNA.


Conflict of interest statement

CONFLICTS OF INTEREST

The authors disclose that they have no potential conflicts of interest.

Figures
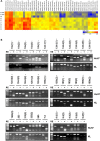
Figure 1
Figure 1. Differential DNA methylation profile of miRNAs in normal livers and HCC cells
(A) Unsupervised hierarchical cluster analysis of the CpG microarray data from two normal liver tissues (NL-1663 and NL-4149), one normal liver cell (HH) and six HCC cells (G2, H7, J7, 3B, ML, SK). Each row represents a sample, and each column represents a miRNA. The color score (bottom right) depicts the log-transformed and normalized intensity. Hyper-methylated and hypo-methylated miRNAs are indicated in red and blue, respectively. The abbreviations of HCC cell lines are as follows: G2, HepG2; H7: HuH7; 3B, Hep3B; ML, Mahlavu; SK, SK-Hep-1. (B) The results of COBRA in HuH7 and normal liver (NL). Following PCR amplification of sodium bisulfite-converted DNA, PCR products were incubated with or without restriction enzyme (RE) as indicated by plus or minus sign. Different regions of the same miRNA are shown as parentheses. Lane 1, 100-bp DNA marker. Stars represent significant hypermethylation in HuH7.
Figure 2
Figure 2. Methylation status of candidate miRNAs and genes in HCC tissues
HCC samples were classified into 5 groups as shown in the first column. The filled squares represent the higher methylation level in tumor and the open squares represent the higher methylation level in adjacent normal tissue. The percentage of methylated samples (tumor vs. adjacent normal) was calculated and shown at the bottom. The codes are as follows: G2: RASSF1A, G9: RUNX3, G7: APC, M29: miR-589, M3: miR-10b (C), M5: miR-203, M9: miR-124-3 (A), M10: miR-124-3 (B), M11: miR-124-3 (D), M30: miR-589 (C), M19: miR-647, M7: miR-129-2, G6: COX2, G5: CDKN2A, M2: miR-10b (A), M16: miR-671, M20: miR-335, M6: miR-339B.
Figure 3
Figure 3. Methylation levels of candidate genes and miRNAs in clinical plasma samples
Methylation levels of (A) APC, (B) COX2, (C) RASSF1A, and (D) miR-203 were determined by qMSP in plasma samples from healthy controls (n = 50) and patients with hepatitis (including hepatitis B and hepatitis C; n = 47), hepatitis with cirrhosis (including hepatitis B and hepatitis C; n = 57) and HCC (HBV-related, HBV-related with cirrhosis, HCV-related and HCV-related with cirrhosis; n = 203). Methylation levels were transformed by log 2 and depicted by box plots. Boxes extend from 25th to 75th percentiles and are divided by a solid line that represents the median of each group and a diamond that represents the mean of each group. Whiskers extend from the 5th to the 95th percentiles. Each outlier is denoted by a dot. F test was used to determine statistical significance.
Figure 4
Figure 4. Receiver operator characteristic (ROC) curves for the diagnosis of HBV-related HCC versus non-cancerous control
(A) ROC curve analysis for APC [AUC=0.644], COX2 (AUC = 0.758), RASSF1A (AUC = 0.666), miR-203 (AUC = 0.55) and the four candidate combination (AUC = 0.865). (B) A MPM-B cut-off value of 0.4 for differentiating between HBV-related HCC and non-cancerous control. (C) ROC curve for leave-one-out cross-validation of MPM-B (AUC = 0.8548). (D) ROC curve for serum AFP to discriminate between HBV-related HCC and non-cancerous control (AUC = 0.62).
Figure 5
Figure 5. Comparison of sensitivity scores of AFP level and MPM-B in HBV-related HCC patients
Scatter plot shows the distribution of 113 HBV-related HCC patients with the cut-off values of AFP (y-axis) and MPM-B (x-axis) as indicated. Serum AFP level was shown as natural log transformed. Each circle represents an individual HBV-related HCC case. The vertical reference line depicts the 20 ng/ml AF P value. A horizontal reference line depicts the MPM-B score of 0.4. The number of cases and the percent of the total HBV-related HCC in each of four areas are as indicated.
Figure 6
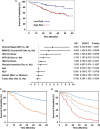
Figure 6. Prognostic potential of risk factors, AFP and MPM-BC in HCC patients
(A) Kaplan-Meier analysis of overall survival for HCC patients classified as high- and low- risk groups according to MPM-BC with cutoff value of 0.45. (B) Multivariate Cox proportional-hazards model for overall survival. HR, hazard ratio; *, HBV-related HCC as a reference. (C) Covariate-adjusted survival curve stratified by high (orange) and low (blue) risk groups. (D) Covariate-adjusted survival curve stratified by both the AFP levels and the MPM-BC score. Blue line: MPM-BC ≤ 0.45 and AFP ≤ 20 ng/mL; Orange line: MPM-BC ≤ 0.45 and AFP > 20 ng/mL; Gray line: MPM-BC > 0.45 and AFP ≤ 20 ng/mL; Red line: MPM-BC > 0.45 and AFP > 20 ng/mL.

References

    1. Zamcheck N, Pusztaszeri G. CEA. AFP and other potential tumor markers. CA Cancer J Clin. 1975;25:204–214. - PubMed
    1. Millington GW. Genomic imprinting and dermatological disease. Clin Exp Dermatol. 2006;31:681–688. - PubMed
    1. Strathdee G, Brown R. Aberrant DNA methylation in cancer: potential clinical interventions. Expert Rev Mol Med. 2002;4:1–17. - PubMed
    1. Kunej T, Godnic I, Ferdin J, Horvat S, Dovc P, Calin GA. Epigenetic regulation of microRNAs in cancer: an integrated review of literature. Mutat Res. 2011;717:77–84. - PubMed
    1. Friedman RC, Farh KK, Burge CB, Bartel DP. Most mammalian mRNAs are conserved targets of microRNAs. Genome Res. 2009;19:92–105. - PMC - PubMed

MeSH terms