

A first approach to evaluate the cell dose in highly porous scaffolds by using a nondestructive metabolic method
- PMID: 28031911
- PMCID: PMC5137907
- DOI: 10.4155/fso.15.58
A first approach to evaluate the cell dose in highly porous scaffolds by using a nondestructive metabolic method
Abstract
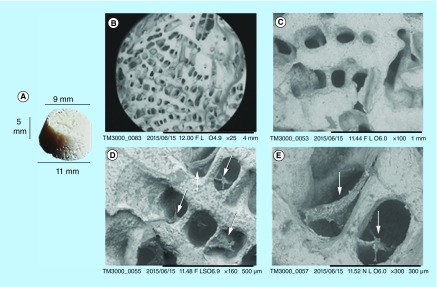
Background: In cell-based therapies, in vitro studies on biomimetic cell-scaffold constructs can facilitate the determination of the cell dose, a key factor in guaranteeing the effectiveness of the treatment. However, highly porous scaffolds do not allow a nondestructive evaluation of the cell number. Our objective was to develop a nondestructive method for human mesenchymal stem cells dose evaluation in a highly porous scaffold for bone regeneration.
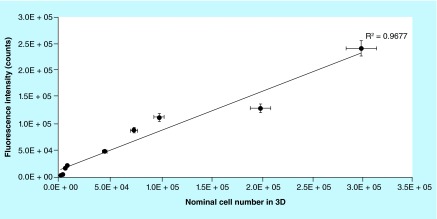
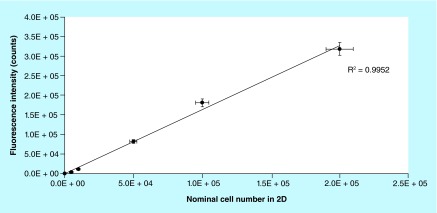
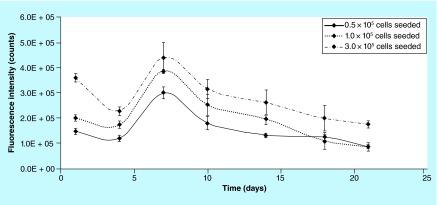
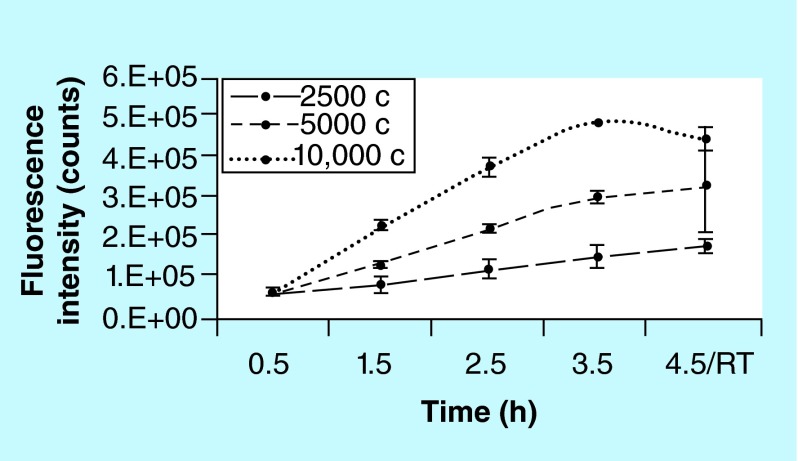
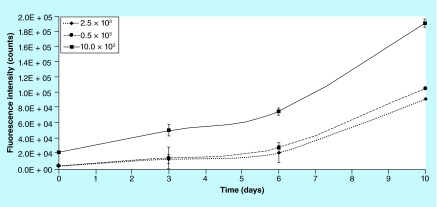
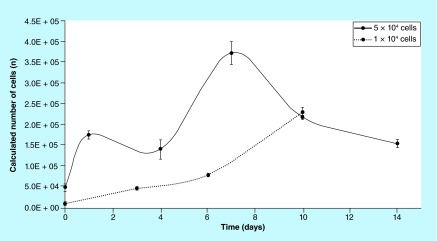
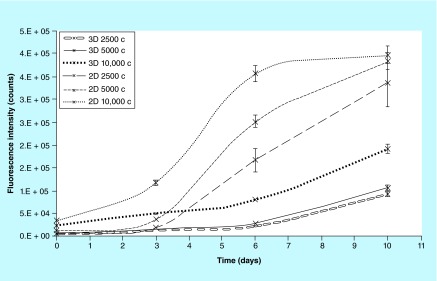
Materials & measurement method: Proliferation trend of human mesenchymal stem cells on Biocoral® scaffolds was measured by a resazurin-based assay here optimized for 3D cultures. The method allows to noninvasively follow the cell proliferation on biocorals over 3 weeks with very high reproducibility.
Conclusion: This reliable method could be a powerful tool in cell-based therapies for cell dose determination.
Keywords: Biocoral®; cell dose; cell number; cell proliferation; hMSCs; nondestructive methods; porous scaffolds.
Conflict of interest statement
Financial & competing interests disclosure The research leading to these results was partially founded by the Regione Piemonte under CIPE 2007 “bando converging technologies” – Grant Agreement No. 0126000010 – METREGEN. The authors have no other relevant affiliations or financial involvement with any organization or entity with a financial interest in or financial conflict with the subject matter or materials discussed in the manuscript apart from those disclosed. No writing assistance was utilized in the production of this manuscript.
Figures
Similar articles
-
Proliferation and osteogenesis of immortalized bone marrow-derived mesenchymal stem cells in porous polylactic glycolic acid scaffolds under perfusion culture.J Biomed Mater Res A. 2010 Mar 1;92(3):817-29. doi: 10.1002/jbm.a.32378. J Biomed Mater Res A. 2010. PMID: 19280635
-
In vivo regenerative properties of coralline-derived (biocoral) scaffold grafts in human maxillary defects: demonstrative and comparative study with Beta-tricalcium phosphate and biphasic calcium phosphate by synchrotron radiation x-ray microtomography.Clin Implant Dent Relat Res. 2014 Oct;16(5):736-50. doi: 10.1111/cid.12039. Epub 2013 Jan 25. Clin Implant Dent Relat Res. 2014. PMID: 23350548
-
Bone regeneration from human mesenchymal stem cells on porous hydroxyapatite-PLGA-collagen bioactive polymer scaffolds.Biomed Mater Eng. 2017;28(6):671-685. doi: 10.3233/BME-171703. Biomed Mater Eng. 2017. PMID: 29171970
-
Evaluation of Proliferation and Osteogenic Differentiation of Human Umbilical Cord-Derived Mesenchymal Stem Cells in Porous Scaffolds.Adv Exp Med Biol. 2019;1084:207-220. doi: 10.1007/5584_2019_343. Adv Exp Med Biol. 2019. PMID: 31214911
-
Porous Scaffolds for Regeneration of Cartilage, Bone and Osteochondral Tissue.Adv Exp Med Biol. 2018;1058:171-191. doi: 10.1007/978-3-319-76711-6_8. Adv Exp Med Biol. 2018. PMID: 29691822 Review.
Cited by
-
Optimizing resazurin-based viability assays for P-MSC/TER308 cell line to enhance results reliability.BMC Res Notes. 2025 May 22;18(1):228. doi: 10.1186/s13104-025-07298-w. BMC Res Notes. 2025. PMID: 40405215 Free PMC article.
-
Standard Operating Procedure to Optimize Resazurin-Based Viability Assays.Biosensors (Basel). 2024 Mar 26;14(4):156. doi: 10.3390/bios14040156. Biosensors (Basel). 2024. PMID: 38667149 Free PMC article. Review.
-
DNA-DAPI Interaction-Based Method for Cell Proliferation Rate Evaluation in 3D Structures.Curr Issues Mol Biol. 2021 May 30;43(1):251-263. doi: 10.3390/cimb43010021. Curr Issues Mol Biol. 2021. PMID: 34070775 Free PMC article.
-
Hydroxyapatite or Fluorapatite-Which Bioceramic Is Better as a Base for the Production of Bone Scaffold?-A Comprehensive Comparative Study.Int J Mol Sci. 2023 Mar 14;24(6):5576. doi: 10.3390/ijms24065576. Int J Mol Sci. 2023. PMID: 36982648 Free PMC article.
-
Development of a multicellular 3D-bioprinted microtissue model of human periodontal ligament-alveolar bone biointerface: Towards a pre-clinical model of periodontal diseases and personalized periodontal tissue engineering.Genes Dis. 2020 Nov 28;9(4):1008-1023. doi: 10.1016/j.gendis.2020.11.011. eCollection 2022 Jul. Genes Dis. 2020. PMID: 35685479 Free PMC article.
References
-
- Yang J, Yamato M, Nishida K, et al. Cell delivery in regenerative medicine: the cell sheet engineering approach. J. Control. Release. 2006;116:193–203. - PubMed
-
• Importance of 3D models.
-
- Meyer U, Wiesmann HP. Bone and Cartilage Engineering. Springer Publishing; Berlin, Heidelberg, Germany: 2006. pp. 121–130.
-
- Caplan AI. Adult mesenchymal stem cells for tissue engineering versus regenerative medicine. J. Cell. Physiol. 2007;213:341–347. - PubMed
-
• Highlight important concepts addressed in the manuscript about hMSCs potentiality for RM.
LinkOut - more resources
Full Text Sources
Other Literature Sources