

Effects of isoflurane anesthesia on resting-state fMRI signals and functional connectivity within primary somatosensory cortex of monkeys
- PMID: 28032008
- PMCID: PMC5167001
- DOI: 10.1002/brb3.591
Effects of isoflurane anesthesia on resting-state fMRI signals and functional connectivity within primary somatosensory cortex of monkeys
Abstract
Introduction: Correlated low-frequency fluctuations of resting-state functional magnetic resonance imaging (rsfMRI) signals have been widely used for inferring intrinsic brain functional connectivity (FC). In animal studies, accurate estimate of anesthetic effects on rsfMRI signals is demanded for reliable interpretations of FC changes. We have previously shown that inter-regional FC can reliably delineate local millimeter-scale circuits within digit representations of primary somatosensory cortex (S1) subregions (areas 3a, 3b, and 1) in monkeys under isoflurane anesthesia. The goals of this study are to determine (1) the general effects of isoflurane on rsfMRI signals in the S1 circuit and (2) whether the effects are functional- and regional- dependent, by quantifying the relationships between isoflurane levels, power and inter-regional correlation coefficients in digit and face regions of distinct S1 subregions.
Methods: Functional MRI data were collected from male adult squirrel monkeys at three different isoflurane levels (1.25%, 0.875%, and 0.5%). All scans were acquired on a 9.4T magnet with a 3-cm-diameter surface transmit-receive coil centered over the S1 cortex. Power and seed-based inter-regional functional connectivity analyses were subsequently performed.
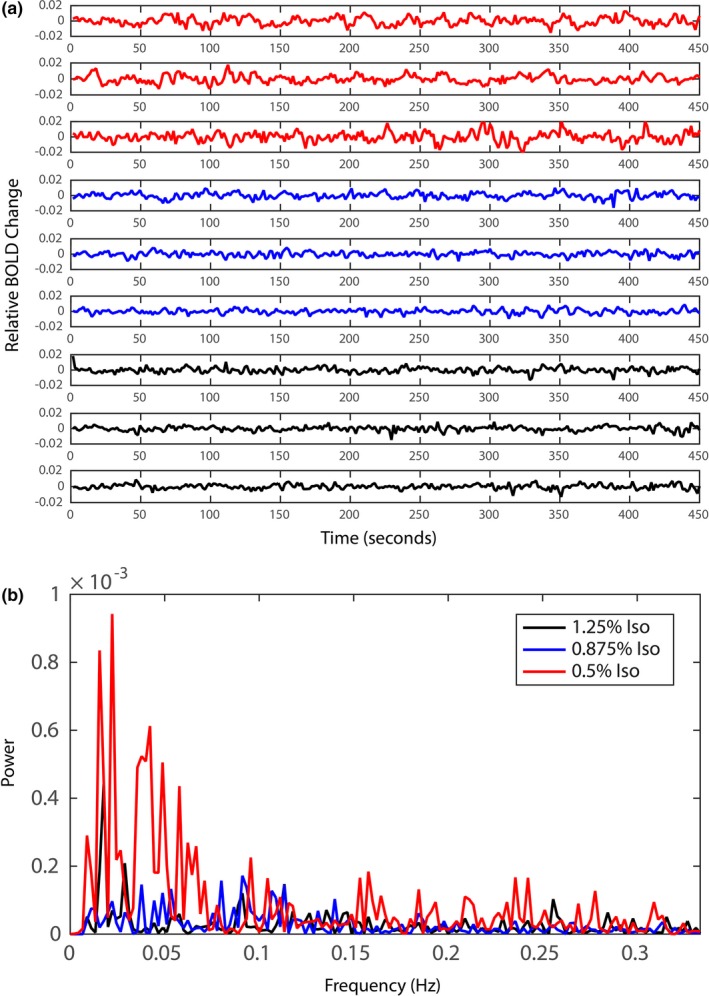
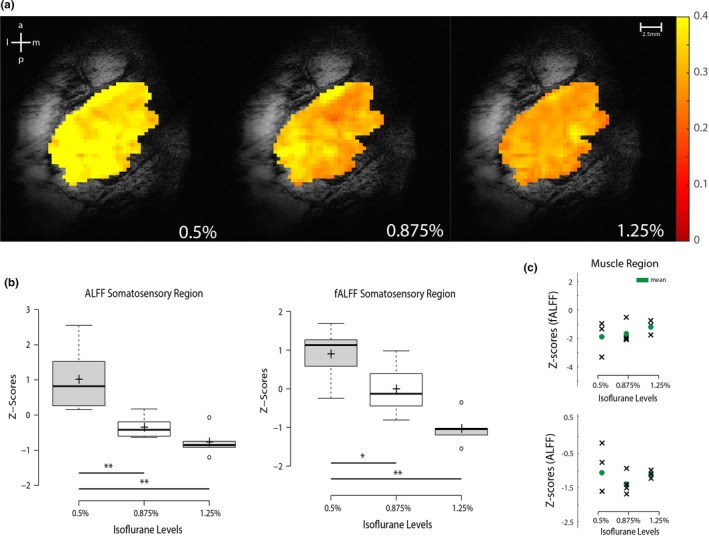
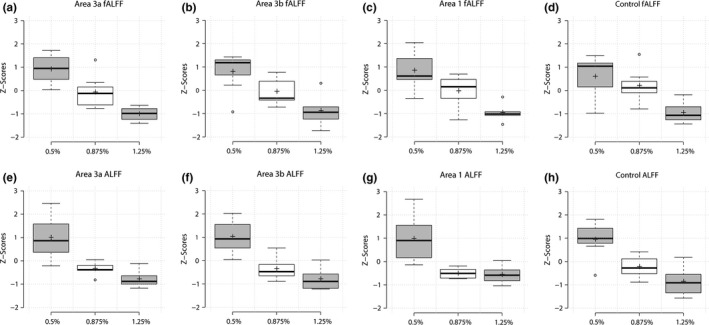
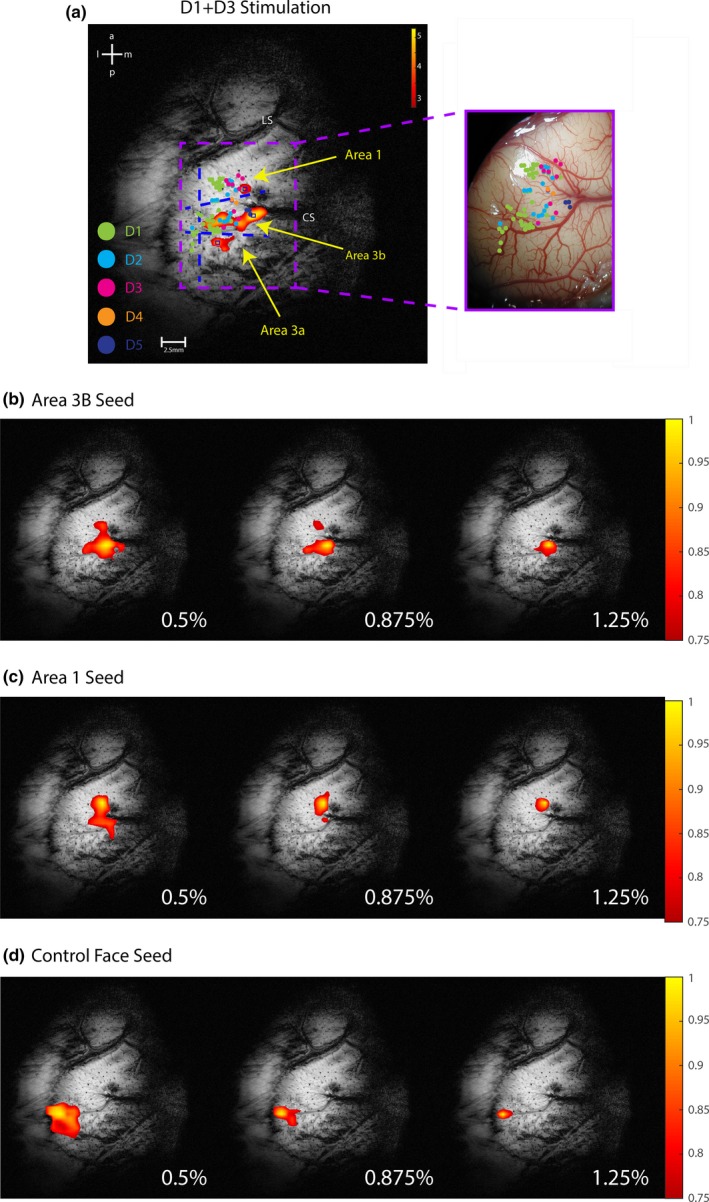
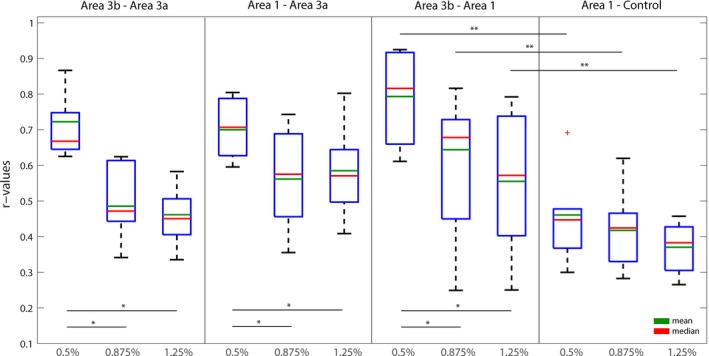
Results: As anesthesia level increased, we observed (1) diminishing amplitudes of signal fluctuations, (2) reduced power of fluctuations in the low-frequency band used for connectivity measurements, (3) decreased inter-voxel connectivity around seed regions, and (4) weakened inter-regional FC across all pairs of regions of interest (digit-to-digit). The low-frequency power measures derived from rsfMRI signals from control muscle regions, however, did not exhibit any isoflurane level-related changes. Within the isoflurane dosage range we tested, the inter-regional functional connectivity differences were still detectable, and the effects of isoflurane did not differ across region-of-interest (ROI) pairs.
Conclusion: Our data demonstrate that isoflurane induced similar dose-dependent suppressive effects on the power of rsfMRI signals and local fine-scale FC across functionally related but distinct S1 subregions.
Keywords: fMRI; hand; non‐human primates; resting state; somatosensory system.
Figures
References
-
- Alkire, M. T. , Alkire, M. T. , Hudetz, A. G. , Hudetz, A. G. , Tononi, G. , & Tononi, G. (2008). Consciousness and anesthesia. Science, 322, 876–880. doi:10.1126/science.1149213 - DOI - PMC - PubMed
-
- Barttfeld, P. , Uhrig, L. , Sitt, J. D. , Sigman, M. , Jarraya, B. , & Dehaene, S. (2014). Signature of consciousness in the dynamics of resting‐state brain activity. Proceedings of the National Academy of Sciences of the United States of America, 112, 201418031. doi:10.1073/pnas.1418031112 - DOI - PMC - PubMed
-
- Biswal, B. , Yetkin, F. Z. , Haughton, V. M. , & Hyde, J. S. (1995). Functional connectivity in the motor cortex of resting human brain using echo‐planar MRI. Magnetic Resonance in Medicine, 34, 537–541. doi:10.1002/mrm.1910340409 - DOI - PubMed
-
- Chen, L. , Mishra, A. , Newton, A. T. , Morgan, V. L. , Stringer, E. A. , Rogers, B. P. , & Gore, J. C. (2011). Fine‐scale functional connectivity in somatosensory cortex revealed by high‐resolution fMRI. Magnetic Resonance in Medicine, 29, 1330–1337. doi:10.1016/j.mri.2011.08.001 - DOI - PMC - PubMed
-
- Chen, L. M. , Mishra, A. , Yang, P.‐F. , Wang, F. , & Gore, J. C. (2015). Injury alters intrinsic functional connectivity within the primate spinal cord. Proceedings of the National Academy of Sciences of the United States of America, 112, 5991–5996. PMID: 25902510. doi:10.1073/pnas.1424106112 - DOI - PMC - PubMed
Publication types
MeSH terms
Substances
Grants and funding
LinkOut - more resources
Full Text Sources
Other Literature Sources
Research Materials
