. 2016 Dec 29;7(12):e2563.
doi: 10.1038/cddis.2016.423.

Regulation of ER stress-induced autophagy by GSK3β-TIP60-ULK1 pathway

Affiliations

Regulation of ER stress-induced autophagy by GSK3β-TIP60-ULK1 pathway

Tiejian Nie et al. Cell Death Dis. .

Abstract

Endoplasmic reticulum (ER) stress is involved in many cellular processes. Emerging evidence suggests that ER stress can trigger autophagy; however, the mechanisms by which ER stress regulates autophagy and its role in this condition are not fully understood. HIV Tat-interactive protein, 60 kDa (TIP60) is a newly discovered acetyltransferase that can modulate autophagy flux by activating ULK1 upon growth factor deprivation. In this study, we investigated the mechanisms by which ER stress induces autophagy. We showed that ER stress activates glycogen synthase kinase-3β (GSK3β). This led to a GSK3β-dependent phosphorylation of TIP60, triggering a TIP60-mediated acetylation of ULK1 and activation of autophagy. Inhibition of either GSK3β or TIP60 acetylation activities significantly attenuated ER stress-induced autophagy. Moreover, enhancing the level of TIP60 attenuated the level of CHOP after ER stress, and reduced the ER stress-induced cell death. In contrast, expression of TIP60 mutant that could not be phosphorylated by GSK3β exacerbated the generation of CHOP and increased the ER stress-induced cell death. These findings reveal that ER stress engages the GSK3β-TIP60-ULK1 pathway to increase autophagy. Attenuation of this pathway renders cells more sensitive to and increases the toxicity of ER stress.


Figures

Figure 1
Figure 1
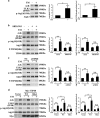
GSK3β-dependent phosphorylation of TIP60 under ER stress. (a) Time-dependent activation of GSK3β and TIP60 phosphorylation. HeLa cell lysates treated with TM (10 μg/ml) induced a time-dependent increase in the level of GRP78 and PERK (bottom panel). The same lysates were blotted for total and phosphorylated TIP60 (S86) and GSK3β (Ser9) (top panel). (b) The effect of GSK3β inhibitor on TM-induced TIP60 phosphorylation. HeLa cells were co-treated with TM (10 μg/ml) and DMSO (mock) or GSK3β inhibitor SB216763 (10 μM) for 24 h. The lysates were blotted for TIP60 as indicated. TIP60 Ser86 phosphorylation levels were calculated and normalized to total TIP60. Data represent the mean±S.E.M. of three independent experiments (**P<0.01; NS, not significant (two-way analysis of variance (ANOVA) followed by Tukey's test)). (c) The effect of GSK3β knockdown on TM-induced TIP60 phosphorylation. HeLa cells were transfected with control (NC) or GSK3β small interfering RNA (siRNA) for 48 h were treated with TM (10 μg/ml) for 24 h. The endogenous GSK3β level (third panel) and total and phosphorylated TIP60 levels were determined. Data represent the mean±S.E.M. of three independent experiments (**P<0.01; NS, not significant (two-way ANOVA followed by Tukey's test)). (df) HeLa cells were treated with TG (1 μM). The lysates were blotted as indicated. In (e and f), the detection of phosphorylated TIP60 (S86) was carried out as described in (b and c) after 16 h of TG exposure. Asterisk indicates the nonspecific band. Data represent the mean±S.E.M. of three independent experiments (**P<0.01; NS, not significant (two-way ANOVA followed by Tukey's test))
Figure 2
Figure 2
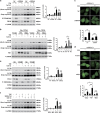
Acetylation of ULK1 by TIP60 under ER stress. (a) TM-induced acetylation of ULK1. Endogenous ULK1, which was immunoprecipitated from cell lysates that were harvested after 24 h TM (10 μg/ml) treatment, was blotted with an antibody against acetylated lysine. The same membrane was reprobed with anti-ULK1 antibody. The total cell lysates was blotted with anti-P-Atg13 (S318) antibody and anti-Atg13 antibody. Ratio of acetylated ULK1 to total ULK1 and phosphorylated Atg13 to total Atg13 were calculated. Data represent the mean±S.E.M. of three independent experiments (*P<0.05 (Student's t-test)). (b) The effect of GSK3β inhibitor on TM-induced acetylation of ULK1. HeLa cells were treated as described in Figure 1b. The total and acetylated ULK1 levels were determined following immunoprecipitation as described in (a). Total cell lysates were blotted as indicated. Data represent the mean±S.E.M. of three independent experiments (**P<0.01; NS, not significant (two-way analysis of variance (ANOVA) followed by Tukey's test)). (c) The effect of TIP60 knockdown on TM-induced ULK1 acetylation. HeLa cells transfected with control (NC) or TIP60 small interfering RNA (siRNA) for 48 h were treated with TM (10 μg/ml) for 24 h. The lysates were analyzed for total and acetylated ULK1. Total cell lysates were blotted as indicated. Data represent the mean±S.E.M. of three independent experiments (**P<0.01; NS, not significant (two-way ANOVA followed by Tukey's test)). (d) The effect of modulating TIP60 on TM-induced ULK1 acetylation. HeLa cells transfected with Vector, wild type (WT) or S86A TIP60 were treated with TM (10 μg/ml) and analyzed for ULK1 acetylation after immunoprecipitation. Total cell lysates were blotted as indicated. Data represent the mean±S.E.M. of three independent experiments (*P<0.05; **P<0.01; NS, not significant (two-way ANOVA followed by Tukey's test)). (eh) HeLa cells were treated with TG (1 μM). The lysates were blotted as indicated. The detection and analysis of acetylated ULK1, phosphorylated Atg13 (S318) and phosphorylated TIP60 (S86) were carried out as described in (ad) after 16 h of TG exposure. Data represent the mean±S.E.M. of three independent experiments. (e) *P<0.05 (Student's t test); (fh) *P<0.05; **P<0.01; NS, not significant (two-way ANOVA followed by Tukey's test)
Figure 2
Figure 2
Acetylation of ULK1 by TIP60 under ER stress. (a) TM-induced acetylation of ULK1. Endogenous ULK1, which was immunoprecipitated from cell lysates that were harvested after 24 h TM (10 μg/ml) treatment, was blotted with an antibody against acetylated lysine. The same membrane was reprobed with anti-ULK1 antibody. The total cell lysates was blotted with anti-P-Atg13 (S318) antibody and anti-Atg13 antibody. Ratio of acetylated ULK1 to total ULK1 and phosphorylated Atg13 to total Atg13 were calculated. Data represent the mean±S.E.M. of three independent experiments (*P<0.05 (Student's t-test)). (b) The effect of GSK3β inhibitor on TM-induced acetylation of ULK1. HeLa cells were treated as described in Figure 1b. The total and acetylated ULK1 levels were determined following immunoprecipitation as described in (a). Total cell lysates were blotted as indicated. Data represent the mean±S.E.M. of three independent experiments (**P<0.01; NS, not significant (two-way analysis of variance (ANOVA) followed by Tukey's test)). (c) The effect of TIP60 knockdown on TM-induced ULK1 acetylation. HeLa cells transfected with control (NC) or TIP60 small interfering RNA (siRNA) for 48 h were treated with TM (10 μg/ml) for 24 h. The lysates were analyzed for total and acetylated ULK1. Total cell lysates were blotted as indicated. Data represent the mean±S.E.M. of three independent experiments (**P<0.01; NS, not significant (two-way ANOVA followed by Tukey's test)). (d) The effect of modulating TIP60 on TM-induced ULK1 acetylation. HeLa cells transfected with Vector, wild type (WT) or S86A TIP60 were treated with TM (10 μg/ml) and analyzed for ULK1 acetylation after immunoprecipitation. Total cell lysates were blotted as indicated. Data represent the mean±S.E.M. of three independent experiments (*P<0.05; **P<0.01; NS, not significant (two-way ANOVA followed by Tukey's test)). (eh) HeLa cells were treated with TG (1 μM). The lysates were blotted as indicated. The detection and analysis of acetylated ULK1, phosphorylated Atg13 (S318) and phosphorylated TIP60 (S86) were carried out as described in (ad) after 16 h of TG exposure. Data represent the mean±S.E.M. of three independent experiments. (e) *P<0.05 (Student's t test); (fh) *P<0.05; **P<0.01; NS, not significant (two-way ANOVA followed by Tukey's test)
Figure 3
Figure 3
The essential role of GSK3β-TIP60-ULK1 pathway in ER stress-induced autophagy. (a) HeLa cells transfected with control (NC) or TIP60 small interfering RNA (siRNA) for 48 h were treated with TM (10 μg/ml)and bafilomycin A1 (400 μM) for 24 h. The lysates were blotted for LC3B, total and phosphorylated TIP60. The relative amounts of LC3BII were calculated from densitometry performed on immunoblots and normalized to the amount of glyceraldehyde 3-phosphate dehydrogenase (GAPDH). Data represent the mean±S.E.M. of three independent experiments (**P<0.01; NS, not significant (two-way analysis of variance (ANOVA) followed by Tukey's test)). (b) The effect of modulating TIP60 on TM-induced change in LC3BII. HeLa cells transfected with Vector, Myc-TIP60 (wild type (WT)) or Myc-TIP60 (S86A) for 20 h were treated with TM (10 μg/ml) and bafilomycin A1 (400 μM) for another 24 h. The lysates were immunoblotted as indicated. Data represent the mean±S.E.M. of three independent experiments (*P<0.05; **P<0.01; NS, not significant (two-way ANOVA followed by Tukey's test)). (c) The effect of knockdown TIP60 on TM-induced LC3B puncta formation. HeLa cells co-transfected with GFP-LC3 (green) and TIP60 small interfering RNA (siRNA) for 48 h were treated with TM (10 μg/ml) for 24 h and scored for the number of puncta. Quantification shown above represents the mean GFP puncta per cell (n=12) from three independent experiments±S.E.M. (**P<0.01; NS, not significant (two-way ANOVA followed by Tukey's test); scale bar, 20 μm). (d) The effect of modulating TIP60 on TM-induced LC3B puncta formation. HeLa cells were transfected as indicated and then treated with TM (10 μg/ml) for another 24 h. LC3B puncta formation was evaluated as described in (c) (*P<0.05; **P<0.01, NS, not significant (two-way ANOVA followed by Tukey's test); scale bar, 20 μm). (e) The effect of ULK1 knockdown on TM-induced change in LC3BII. HeLa cells were transfected with control (NC) or ULK1 siRNA for 48 h were treated with TM (10 μg/ml) and bafilomycin A1 (400 μM) for another 24 h. The lysates were immunoblotted as indicated. Data represent the mean±S.E.M. of three independent experiments (**P<0.01; NS, not significant (two-way ANOVA followed by Tukey's test)). (f) The effect of GSK3β inhibitor on TM-induced LC3BII change. HeLa cells were treated with TM (10 μg/ml) with or without SB216763 (10 μM) and bafilomycin A1 (400 μM) for 24 h. LC3BII level was determined. Data represent the mean±S.E.M. of three independent experiments (**P<0.01; NS, not significant (two-way ANOVA followed by Tukey's test))
Figure 4
Figure 4
Hydrogen peroxide (H2O2)-induced ER stress and activation of GSK3β-TIP60-ULK1 pathway. (a) H2O2-induced ER stress. HeLa cells were treated with H2O2 (1 or 3 mM). Cell lysates were gathered at the indicated time points and blotted for the ER stress markers as indicated. (b) H2O2-induced activation of GSK3β, TIP60 and ULK1. HeLa cells were treated with H2O2 (1 mM) with or without 4-PBA (2 mM) for the indicated time. Cell lysates were blotted as indicated. Densitometric analyses of the western blots are shown as curves. Data represent mean±S.E.M. of three independent experiments (*P<0.05; **P<0.01 (two-tailed Student's t-test)). (ce) The effect of modulating GSK3β-TIP60-ULK1 pathway on H2O2-induced change in LC3BII. HeLa cells were treated as described in Figures 3b, e and f, except that H2O2 (1 mM)and bafilomycin A1 (400 μM) for another 18 h. The lysates were immunoblotted as indicated. LC3BII level was determined. Data represent the mean±S.E.M. of three independent experiments (*P<0.05; **P<0.01; NS, not significant (two-way analysis of variance (ANOVA) followed by Tukey's test))
Figure 5
Figure 5
The role of TIP60 and ULK1 in ER stress-induced changes in C/EBP Homologous Protein (CHOP). (a and b) The effect of modulating TIP60 on TM- or hydrogen peroxide (H2O2)-induced changes in CHOP levels. HeLa cells were transfected as indicated for 20 h and then treated with TM (10 μg/ml) or H2O2 (1 mM). Cell lysates were blotted for CHOP, Myc and glyceraldehyde 3-phosphate dehydrogenase (GAPDH). The right curves show the quantification of relative levels of CHOP. Data represent the mean±S.E.M. of three independent experiments (*P<0.05; **P<0.01 versus Vector; #P<0.01 versus wild type (WT) (two-way analysis of variance (ANOVA) followed by Tukey's test)). (c and d) The effect of ULK1 knockdown on TM- or H2O2-induced changes in CHOP levels. HeLa cells were transfected with control (NC) or ULK1 small interfering RNA (siRNA) for 48 h were treated with TM (10 μg/ml) or H2O2 (1 mM). CHOP level was determined. Data represent the mean±S.E.M. of three independent experiments (*P<0.05; **P<0.01 (two-tailed Student's t-test))
Figure 6
Figure 6
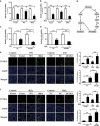
The role of TIP60 and ULK1 in ER stress-induced cellular apoptosis. (a, c and e) The effect of modulating TIP60 and ULK1 on TM-induced changes in HeLa cell viability. HeLa cells were transfected with Vector, Myc-TIP60 (wild type (WT)) or Myc-TIP60 (S86A) for 20 h or transfected with control (NC) or ULK1 small interfering RNA (siRNA) for 48 h and then treated with TM (10 μg/ml)for another 24 h. Cell viability was analyzed with MTT (a and c), or imaged with TUNEL assay (scale bar=20 μm). (e) Data represent the mean±S.E.M. of three independent experiments (*P<0.05; **P<0.01 (two-way analysis of variance (ANOVA) followed by Tukey's test)). (b, d and f) The effect of modulating TIP60 and ULK1 on hydrogen peroxide (H2O2)-induced changes in HeLa cell viability. HeLa cells were transfected as indicated and then treated with H2O2 (1 mM) for 18 h. The measurement of MTT and TUNEL assay were carried out as described above in (a, c and e) (scale bar=20 μm). Data represent the mean±S.E.M. of three independent experiments (**P<0.01 (two-way ANOVA followed by Tukey's test)). (g) Model for the role of GSK3β-TIP60-ULK1 pathway in autophagy induction and cell survival under ER stress

Similar articles

Cited by

References

    1. Xu C, Bailly-Maitre B, Reed JC. Endoplasmic reticulum stress: cell life and death decisions. J Clin Invest 2005; 115: 2656–2664. - PMC - PubMed
    1. Uehara T, Nakamura T, Yao D, Shi ZQ, Gu Z, Ma Y et al. S-nitrosylated protein-disulphide isomerase links protein misfolding to neurodegeneration. Nature 2006; 441: 513–517. - PubMed
    1. Ozcan U, Cao Q, Yilmaz E, Lee AH, Iwakoshi NN, Ozdelen E et al. Endoplasmic reticulum stress links obesity, insulin action, and type 2 diabetes. Science 2004; 306: 457–461. - PubMed
    1. Moreno JA, Radford H, Peretti D, Steinert JR, Verity N, Martin MG et al. Sustained translational repression by eIF2alpha-P mediates prion neurodegeneration. Nature 2012; 485: 507–511. - PMC - PubMed
    1. Hoozemans JJ, Veerhuis R, Van Haastert ES, Rozemuller JM, Baas F, Eikelenboom P et al. The unfolded protein response is activated in Alzheimer's disease. Acta Neuropathol 2005; 110: 165–172. - PubMed

Publication types

MeSH terms

Substances