

Correction of hysteretic respiratory motion in SPECT myocardial perfusion imaging: Simulation and patient studies
- PMID: 28032913
- PMCID: PMC5344194
- DOI: 10.1002/mp.12072
Correction of hysteretic respiratory motion in SPECT myocardial perfusion imaging: Simulation and patient studies
Abstract
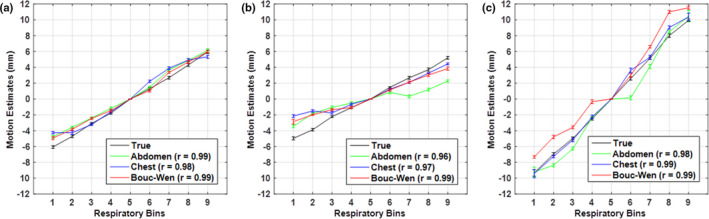
Purpose: Amplitude-based respiratory gating is known to capture the extent of respiratory motion (RM) accurately but results in residual motion in the presence of respiratory hysteresis. In our previous study, we proposed and developed a novel approach to account for respiratory hysteresis by applying the Bouc-Wen (BW) model of hysteresis to external surrogate signals of anterior/posterior motion of the abdomen and chest with respiration. In this work, using simulated and clinical SPECT myocardial perfusion imaging (MPI) studies, we investigate the effects of respiratory hysteresis and evaluate the benefit of correcting it using the proposed BW model in comparison with the abdomen signal typically employed clinically.
Methods: The MRI navigator data acquired in free-breathing human volunteers were used in the specially modified 4D NCAT phantoms to allow simulating three types of respiratory patterns: monotonic, mild hysteresis, and strong hysteresis with normal myocardial uptake, and perfusion defects in the anterior, lateral, inferior, and septal locations of the mid-ventricular wall. Clinical scans were performed using a Tc-99m sestamibi MPI protocol while recording respiratory signals from thoracic and abdomen regions using a visual tracking system (VTS). The performance of the correction using the respiratory signals was assessed through polar map analysis in phantom and 10 clinical studies selected on the basis of having substantial RM.
Results: In phantom studies, simulations illustrating normal myocardial uptake showed significant differences (P < 0.001) in the uniformity of the polar maps between the RM uncorrected and corrected. No significant differences were seen in the polar map uniformity across the RM corrections. Studies simulating perfusion defects showed significantly decreased errors (P < 0.001) in defect severity and extent for the RM corrected compared to the uncorrected. Only for the strong hysteretic pattern, there was a significant difference (P < 0.001) among the RM corrections. The errors in defect severity and extent for the RM correction using abdomen signal were significantly higher compared to that of the BW (severity = -4.0%, P < 0.001; extent = -65.4%, P < 0.01) and chest (severity = -4.1%, P < 0.001; extent = -52.5%, P < 0.01) signals. In clinical studies, the quantitative analysis of the polar maps demonstrated qualitative and quantitative but not statistically significant differences (P = 0.73) between the correction methods that used the BW signal and the abdominal signal.
Conclusions: This study shows that hysteresis in respiration affects the extent of residual motion left in the RM-binned data, which can impact wall uniformity and the visualization of defects. Thus, there appears to be the potential for improved accuracy in reconstruction in the presence of hysteretic RM with the BW model method providing a possible step in the direction of improvement.
Keywords: SPECT; cardiac imaging; hysteresis; respiratory motion.
© 2016 American Association of Physicists in Medicine.
Conflict of interest statement
The authors declare that they do not have any conflict of interest.
Figures


Similar articles
-
Adaptation of the modified Bouc-Wen model to compensate for hysteresis in respiratory motion for the list-mode binning of cardiac SPECT and PET acquisitions: testing using MRI.Med Phys. 2014 Nov;41(11):112508. doi: 10.1118/1.4895845. Med Phys. 2014. PMID: 25370667 Free PMC article.
-
Respiratory average CT for attenuation correction in myocardial perfusion SPECT/CT.Ann Nucl Med. 2017 Feb;31(2):172-180. doi: 10.1007/s12149-016-1144-1. Epub 2016 Dec 20. Ann Nucl Med. 2017. PMID: 28000164
-
Effect of respiratory motion on cardiac defect contrast in myocardial perfusion SPECT: a physical phantom study.Ann Nucl Med. 2019 May;33(5):305-316. doi: 10.1007/s12149-019-01335-y. Epub 2019 Jan 24. Ann Nucl Med. 2019. PMID: 30680536 Free PMC article.
-
Motion Correction and Its Impact on Absolute Myocardial Blood Flow Measures with PET.Curr Cardiol Rep. 2018 Mar 24;20(5):34. doi: 10.1007/s11886-018-0977-8. Curr Cardiol Rep. 2018. PMID: 29574494 Review.
-
Subdiaphragmatic activity-related artifacts in myocardial perfusion scintigraphy.Radiol Oncol. 2024 Sep 15;58(3):313-319. doi: 10.2478/raon-2024-0053. eCollection 2024 Sep 1. Radiol Oncol. 2024. PMID: 39287166 Free PMC article. Review.
Cited by
-
Ultrasound-based sensors for respiratory motion assessment in multimodality PET imaging.Phys Med Biol. 2022 Jan 19;67(2):10.1088/1361-6560/ac4213. doi: 10.1088/1361-6560/ac4213. Phys Med Biol. 2022. PMID: 34891142 Free PMC article.
-
Advances in dual respiratory and ECG-gated SPECT imaging.J Nucl Cardiol. 2018 Oct;25(5):1642-1644. doi: 10.1007/s12350-017-0887-y. Epub 2017 Apr 21. J Nucl Cardiol. 2018. PMID: 28432669 No abstract available.
-
MR-based cardiac and respiratory motion correction of PET: application to static and dynamic cardiac 18F-FDG imaging.Phys Med Biol. 2019 Oct 4;64(19):195009. doi: 10.1088/1361-6560/ab39c2. Phys Med Biol. 2019. PMID: 31394518 Free PMC article.
-
Improving perfusion defect detection with respiratory motion correction in cardiac SPECT at standard and reduced doses.J Nucl Cardiol. 2019 Oct;26(5):1526-1538. doi: 10.1007/s12350-018-1374-9. Epub 2018 Jul 30. J Nucl Cardiol. 2019. PMID: 30062470 Free PMC article.
References
-
- Low DA, Nystrom M, Kalinin E, et al. A method for the reconstruction of four‐dimensional synchronized CT scans acquired during free breathing. Med Phys (Lancaster). 2003;30:1254. - PubMed
-
- Reutter BW, Klein GJ, Brennan KM, Huesman RH. Acquisition and automated 3‐D segmentation of respiratory/cardiac‐gated PET transmission images. IEEE Nucl Sci Symp Conf Rec. 1996;1997:1357–1361.
-
- Kovalski G, Keidar Z, Frenkel A, Israel O, Azhari H. Correction for respiration artefacts in myocardial perfusion SPECT is more effective when reconstructions supporting collimator detector response compensation are applied. J Nucl Cardiol. 2009;16:949–955. - PubMed
-
- Ruan D, Fessler JA, Balter JM. Mean position tracking of respiratory motion. Med Phys. 2008;35:782–792. - PubMed
-
- Nehrke K, Bornert P, Manke D, Bock JC. Free‐breathing cardiac MR imaging: study of implications of respiratory motion‐initial results. Radiol. 2001;220:810–815. - PubMed
MeSH terms
Substances
Grants and funding
LinkOut - more resources
Full Text Sources
Other Literature Sources
