

Differential diagnosis of prostate cancer and noncancerous tissue in the peripheral zone and central gland using the quantitative parameters of DCE-MRI: A meta-analysis
- PMID: 28033274
- PMCID: PMC5207570
- DOI: 10.1097/MD.0000000000005715
Differential diagnosis of prostate cancer and noncancerous tissue in the peripheral zone and central gland using the quantitative parameters of DCE-MRI: A meta-analysis
Abstract
Background: The objective of this meta-analysis was to evaluate the clinical usefulness of K, Kep, and Ve values in the differential diagnosis of prostate cancer (PCa) and noncancerous tissue in the peripheral zone (PZ) and central gland (CG).
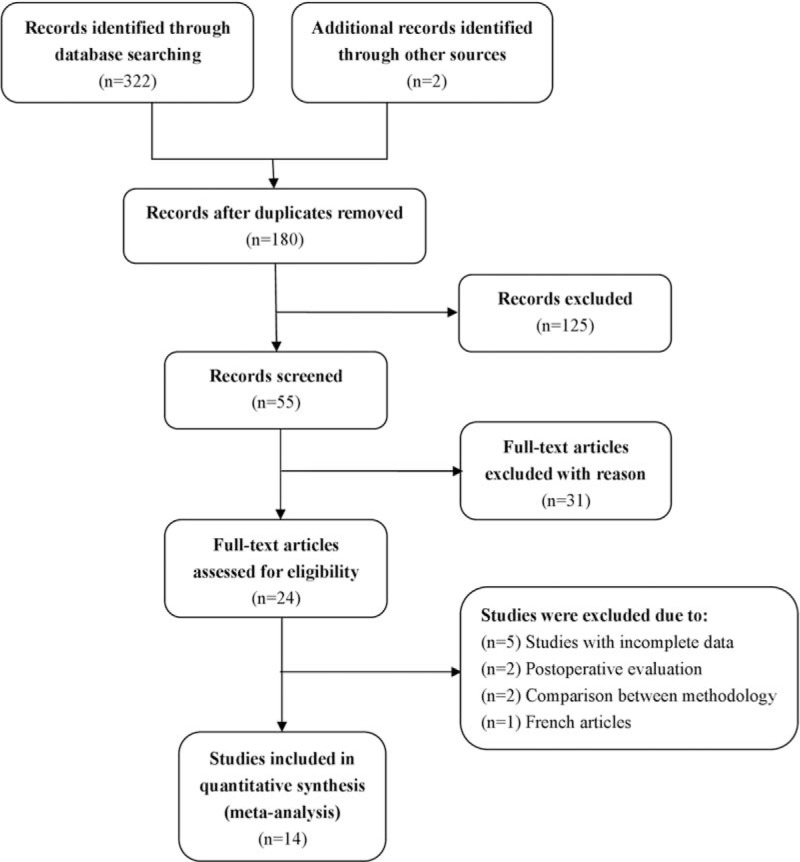
Methods: A search was conducted of the PubMed, MEDLINE, EMBASE, Cochrane Library, China National Knowledge Infrastructure, and Wanfang databases from January 2000 to October 2015 using the search terms "prostate cancer," " dynamic contrast-enhanced (DCE)," "magnetic resonance imaging," "K," "Kep," and "Ve." Studies were selected and included according to strict eligibility criteria. Standardized mean differences (SMDs) and 95% confidence intervals (CIs) were used to compare K, Kep, and Ve values between PCa and noncancerous tissue.
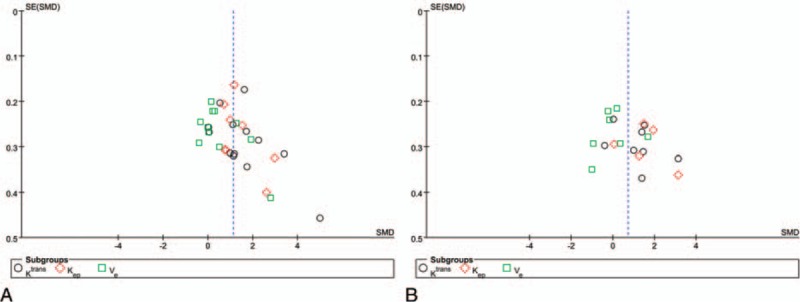
Results: Fourteen studies representing 484 patients highly suspicious for prostate adenocarcinoma were selected for the meta-analysis. We found that K values measured by dynamic contrast-enhanced magnetic resonance imaging (DCE-MRI) were significantly higher in PCa tissue than in noncancerous tissue in the PZ (SMD 1.57, 95% CI 0.98-2.16; z = 5.21, P <0.00001) and CG (SMD 1.19, 95% CI 0.46-1.91; z = 3.21, P = 0.001). Kep values measured by DCE-MRI were significantly higher in PCa than in noncancerous tissue in the PZ (SMD 1.41, 95% CI 0.92-1.91; z = 5.59, P < 0.00001) and CG (SMD 1.57, 95% CI 0.69-2.46; z = 3.49, P = 0.0005). Ve values generated by DCE-MRI were slightly higher in PCa than in noncancerous tissue in the PZ (SMD 0.72, 95% CI 0.17-1.27; z = 2.58, P = 0.010), but sensitivity analysis found that the Ve value was unstable for differentiation between PCa and noncancerous PZ tissue. However, there was no significant difference in the Ve value between PCa and noncancerous CG tissue (SMD -0.29, 95% CI -1.18, 0.59; z = 0.65, P = 0.51).
Conclusion: Our meta-analysis shows that K and Kep were the most reliable parameters for differentiating PCa from noncancerous tissue and were critical for evaluation of the internal structure of cancer. The Ve value was not helpful for distinguishing PCa from noncancerous CG tissue; its ability to distinguish between PCa and noncancerous PZ tissue remains uncertain.
Conflict of interest statement
The authors have no conflicts of interest to disclose.
Figures


Similar articles
-
Quantitative assessment of dynamic 18F-flumethycholine PET and dynamic contrast enhanced MRI in high risk prostate cancer.Br J Radiol. 2019 Feb;92(1094):20180568. doi: 10.1259/bjr.20180568. Epub 2018 Nov 14. Br J Radiol. 2019. PMID: 30383459 Free PMC article.
-
DCE-MRI of the prostate using shutter-speed vs. Tofts model for tumor characterization and assessment of aggressiveness.J Magn Reson Imaging. 2017 Sep;46(3):837-849. doi: 10.1002/jmri.25631. Epub 2017 Jan 16. J Magn Reson Imaging. 2017. PMID: 28092414
-
Quantitative diffusion-weighted imaging and dynamic contrast-enhanced characterization of the index lesion with multiparametric MRI in prostate cancer patients.J Magn Reson Imaging. 2017 Mar;45(3):908-916. doi: 10.1002/jmri.25391. Epub 2016 Jul 21. J Magn Reson Imaging. 2017. PMID: 27442039
-
Diagnostic performance of diffusion-weighted imaging combined with dynamic contrast-enhanced magnetic resonance imaging for prostate cancer: a systematic review and meta-analysis.Acta Radiol. 2021 Sep;62(9):1238-1247. doi: 10.1177/0284185120956269. Epub 2020 Sep 9. Acta Radiol. 2021. PMID: 32903025
-
Can dynamic contrast enhanced MRI predict gleason score in prostate cancer? a systematic review and meta analysis.Urol Oncol. 2021 Nov;39(11):784.e17-784.e25. doi: 10.1016/j.urolonc.2021.03.015. Epub 2021 Apr 29. Urol Oncol. 2021. PMID: 33934966
Cited by
-
Quantitative assessment of dynamic 18F-flumethycholine PET and dynamic contrast enhanced MRI in high risk prostate cancer.Br J Radiol. 2019 Feb;92(1094):20180568. doi: 10.1259/bjr.20180568. Epub 2018 Nov 14. Br J Radiol. 2019. PMID: 30383459 Free PMC article.
-
Longitudinal Correlations Between Intravoxel Incoherent Motion (IVIM) and Dynamic Contrast-Enhanced (DCE) MRI During Radiotherapy in Prostate Cancer Patients.Front Oncol. 2022 Jun 7;12:897130. doi: 10.3389/fonc.2022.897130. eCollection 2022. Front Oncol. 2022. PMID: 35747819 Free PMC article.
-
Impact of contrast agent injection duration on dynamic contrast-enhanced MRI quantification in prostate cancer.NMR Biomed. 2018 Sep;31(9):e3946. doi: 10.1002/nbm.3946. Epub 2018 Jul 5. NMR Biomed. 2018. PMID: 29974981 Free PMC article.
-
Predicting clinically significant prostate cancer using DCE-MRI habitat descriptors.Oncotarget. 2018 Dec 14;9(98):37125-37136. doi: 10.18632/oncotarget.26437. eCollection 2018 Dec 14. Oncotarget. 2018. PMID: 30647849 Free PMC article.
-
Assessing Microcirculation in Resectable Oesophageal Squamous Cell Carcinoma with Dynamic Contrast-enhanced MRI for Identifying Primary tumour and Lymphatic Metastasis.Sci Rep. 2019 Jan 15;9(1):124. doi: 10.1038/s41598-018-36929-5. Sci Rep. 2019. PMID: 30644415 Free PMC article.
References
-
- Siegel R, Ma J, Zou Z, et al. Cancer statistics, 2014. CA Cancer J Clin 2014;64:9–29. - PubMed
-
- Epstein JI, Amin M, Boccon-Gibod L, et al. Prognostic factors and reporting of prostate carcinoma in radical prostatectomy and pelvic lymphadenectomy specimens. Scand J Urol Nephrol Suppl 2005;34–63. - PubMed
-
- Shimizu T, Nishie A, Ro T, et al. Prostate cancer detection: the value of performing an MRI before a biopsy. Acta Radiol 2009;50:1080–8. - PubMed
-
- Zhang X, Wang X, Lu J, et al. MR imaging of incidentally detected prostate carcinoma in the central gland of prostate: preliminary study. Chin J Magn Reson Imaging 2010;1:264–7.
Publication types
MeSH terms
Substances
LinkOut - more resources
Full Text Sources
Other Literature Sources
Medical
