. 2017 Feb 8;17(2):1226-1232.
doi: 10.1021/acs.nanolett.6b05041. Epub 2017 Jan 3.

Quantitative Mapping of the Spatial Distribution of Nanoparticles in Endo-Lysosomes by Local pH

Affiliations

Quantitative Mapping of the Spatial Distribution of Nanoparticles in Endo-Lysosomes by Local pH

Jing Wang et al. Nano Lett. .

Abstract

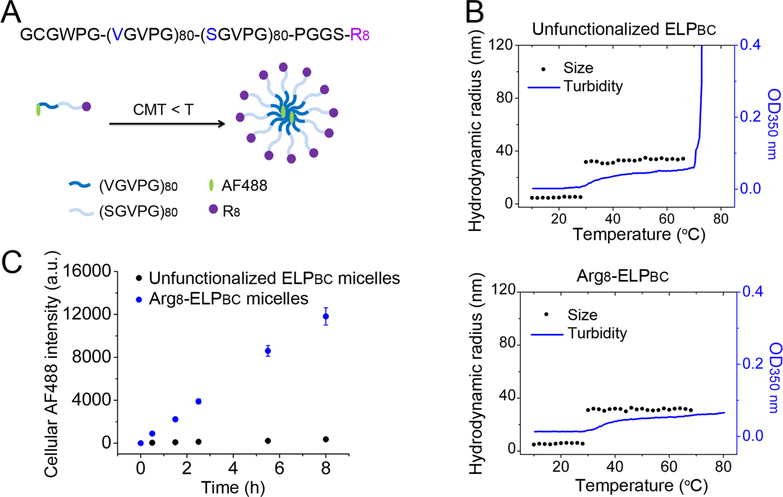
Understanding the intracellular distribution and trafficking of nanoparticle drug carriers is necessary to elucidate their mechanisms of drug delivery and is helpful in the rational design of novel nanoparticle drug delivery systems. The traditional immunofluorescence method to study intracellular distribution of nanoparticles using organelle-specific antibodies is laborious and subject to artifacts. As an alternative, we developed a new method that exploits ratiometric fluorescence imaging of a pH-sensitive Lysosensor dye to visualize and quantify the spatial distribution of nanoparticles in the endosomes and lysosomes of live cells. Using this method, we compared the endolysosomal distribution of cell-penetrating peptide (CPP)-functionalized micelles to unfunctionalized micelles and found that CPP-functionalized micelles exhibited faster endosome-to-lysosome trafficking than unfunctionalized micelles. Ratiometric fluorescence imaging of pH-sensitive Lysosensor dye allows rapid quantitative mapping of nanoparticle distribution in endolysosomes in live cells while minimizing artifacts caused by extensive sample manipulation typical of alternative approaches. This new method can thus serve as an alternative to traditional immunofluorescence approaches to study the intracellular distribution and trafficking of nanoparticles within endosomes and lysosomes.

Keywords: Fluorescence imaging; cell-penetrating peptide; lysosome; nanoparticle.


Conflict of interest statement

The authors declare no competing financial interest.

Figures

Figure 1.
Figure 1.
Method of studying spatial distribution of fluorescent nanoparticles as a function of local pH using ratiometric fluorescence imaging of Lysosensor and pixel-by-pixel analysis. (A) Fluorescence emission spectra of Lysosensor at pH 4 and pH 7 excited at 405 nm and the fluorescence emission spectrum of Alexa Fluor 488 (AF488) excited at 488 nm. Lysosensor exhibits two pH-dependent emission peaks at 440 and 530 nm measured using a blue filter (447 ± 30 nm) and a green filter (525 ± 15 nm), respectively, while the fluorescence of AF488 is measured using a green filter (525 ± 15 nm). The blue and green bars indicate the emission filters used for fluorescence emission measurements. (B) Spinning disk confocal fluorescence images of Lysosensor-Blue, Lysosensor-Green, and AF488 peaks captured in live cells. The white scale bar indicates 2 μm. (C) All fluorescence images are analyzed as 512 pixels × 512 pixels grids where the origin (0, 0) is set at the bottom-left and every pixel is assigned a coordinate (x, y). Fluorescent endolysosomal areas (shown as gray pixels) are identified and distinguished from the largely nonfluorescent cytosol using ImageJ software. (D) The ratio of Lysosensor’s two emission peaks (IBlue/IGreen) in endolysosomal compartments shows a linear relationship with pH in live cells equilibrated with a series of calibration buffers ranging from pH 4 to pH 7.5. Using this IBlue/IGreen ratio versus pH plot, the IBlue/ IGreen ratio of each pixel can be converted to a pH value. (E) Using this method to map endolysosomal pH, normal cells have an endolysosomal pH ranging from pH 4 to pH 7 while chloroquine-treated cells exhibit increased endolysosomal pH. The black scale bar indicates 2 μm and the color bar indicates pH value.
Figure 2.
Figure 2.
Physical characterization and cellular internalization of ELPBC micelles. (A) Scheme of AF488-labeled Arg8-ELPBC self-assembling into micelles triggered by an increase in solution temperature above the CMT. (B) Temperature-programed DLS and turbidimetry of unfunctionalized ELPBC and Arg8-ELPBC. Both self-assemble into ~30 nm hydrodynamic radius micelles in aqueous solution between 30 and 70 °C (unfunctionalized ELPBC) or between 30 and 80 °C (Arg8-ELPBC) with an OD350 nm value (optical density at 350 nm) close to 0.06. When the temperature is above 70 °C, the unfunctionalized ELPBC aggregates and its OD350 nm value dramatically increases. (C) AF488-labeled micelles were incubated with FaDu cells at 37 °C and cellular AF488 fluorescence intensity was quantified by flow cytometry over time. Cellular uptake was much greater for Arg8-ELPBC micelles as a function of time compared with unfunctionalized ELPBC micelles.
Figure 3.
Figure 3.
Intracellular distribution of AF488-labeled ELPBC micelles. (A) Location of unfunctionalized ELPBC micelles and (B) Arg8-ELPBC micelles in endosomes and lysosomes determined by IF. The white scale bar indicates 2 μm. DIC: differential interference contrast. (C) Distribution of unfunctionalized ELPBC micelles and (D) Arg8-ELPBC micelles in endolysosomes as a function of pH, determined by ratiometric fluorescence imaging of Lysosensor dye.
Figure 4.
Figure 4.
Prolonged incubation induced endosome-to-lysosome trafficking of unfunctionalized ELPBC micelles and macropinocytosis inhibitors blocked the endosome-to-lysosome trafficking of Arg8-ELPBC micelles. (A,B) When FaDu cells were incubated with AF488-labeled unfunctionalized ELPBC micelles for 6 h, washed, and imaged 18 h later, the unfunctionalized ELPBC was preferentially distributed in lower pH lysosomes, as quantified by fluorescence ratiometric imaging (A) and confirmed by IF (B). The while scale bar indicates 2 μm. (C) When macropinocytosis was inhibited in FaDu cells by heparinase III inhibitor or by PAK1 siRNA, the accumulation of Arg8-ELPBC micelles in endolysosomes decreased and their distribution became invariant across pH.

Similar articles

Cited by

References

    1. Peer D; Karp JM; Hong S; Farokhzad OC; Margalit R; Langer R Nat. Nanotechnol 2007, 2, 751–760. - PubMed
    1. Watson P; Jones AT; Stephens DJ Adv. Drug Delivery Rev 2005, 57, 43–61. - PubMed
    1. Panariti A; Miserocchi G; Rivolta I Nanotechnol., Sci. Appl 2012, 5, 87–100. - PMC - PubMed
    1. Hillaireau H; Couvreur P Cell. Mol. Life Sci 2009, 66, 2873–2896. - PMC - PubMed
    1. Georgieva JV; Kalicharan D; Couraud P-O; Romero IA; Weksler B; Hoekstra D; Zuhorn IS Mol. Ther 2011, 19, 318–325. - PMC - PubMed

Publication types