. 2017 Mar:139:171-179.
doi: 10.1016/j.antiviral.2016.12.017. Epub 2016 Dec 26.

Discovery of host-targeted covalent inhibitors of dengue virus

Affiliations

Discovery of host-targeted covalent inhibitors of dengue virus

Mélissanne de Wispelaere et al. Antiviral Res. 2017 Mar.

Abstract

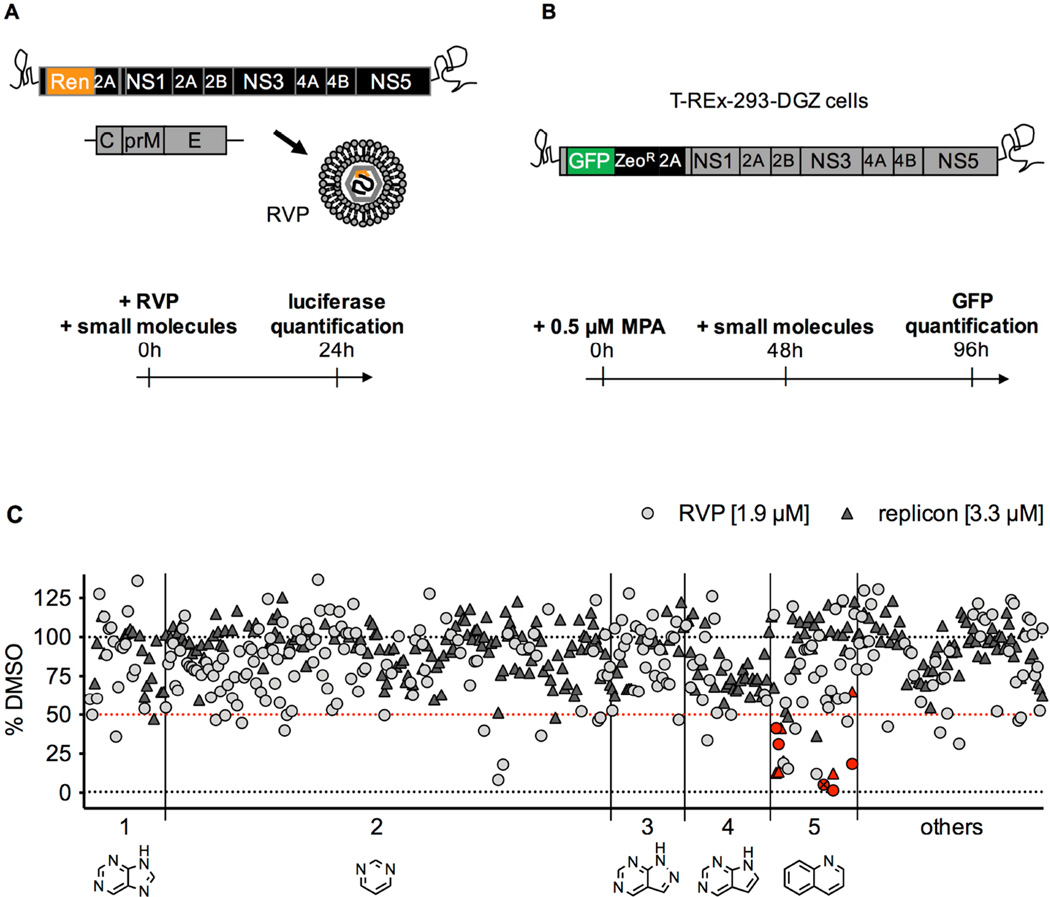
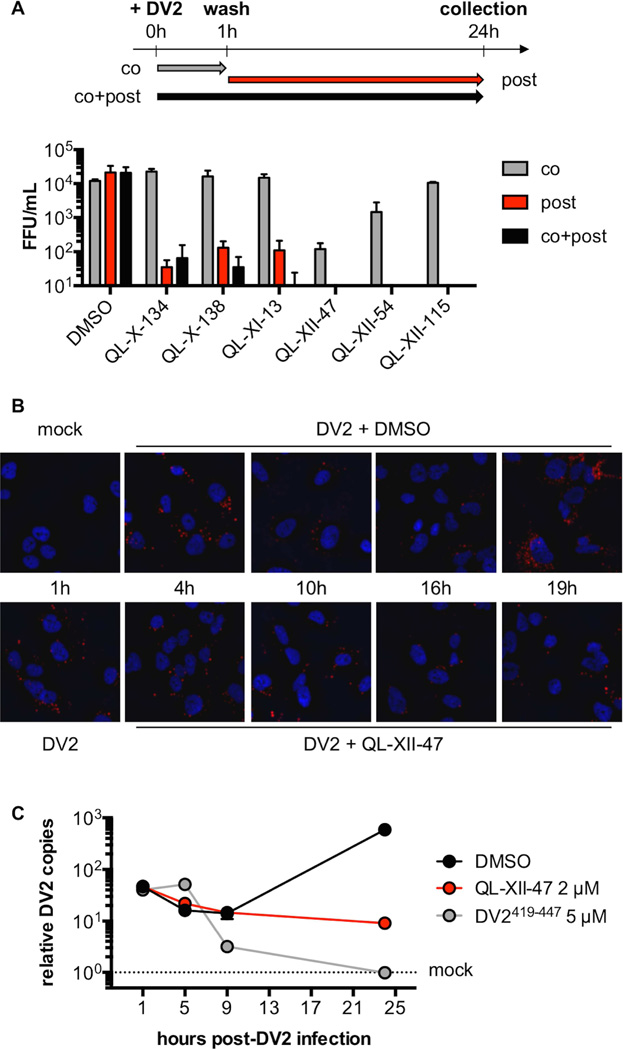
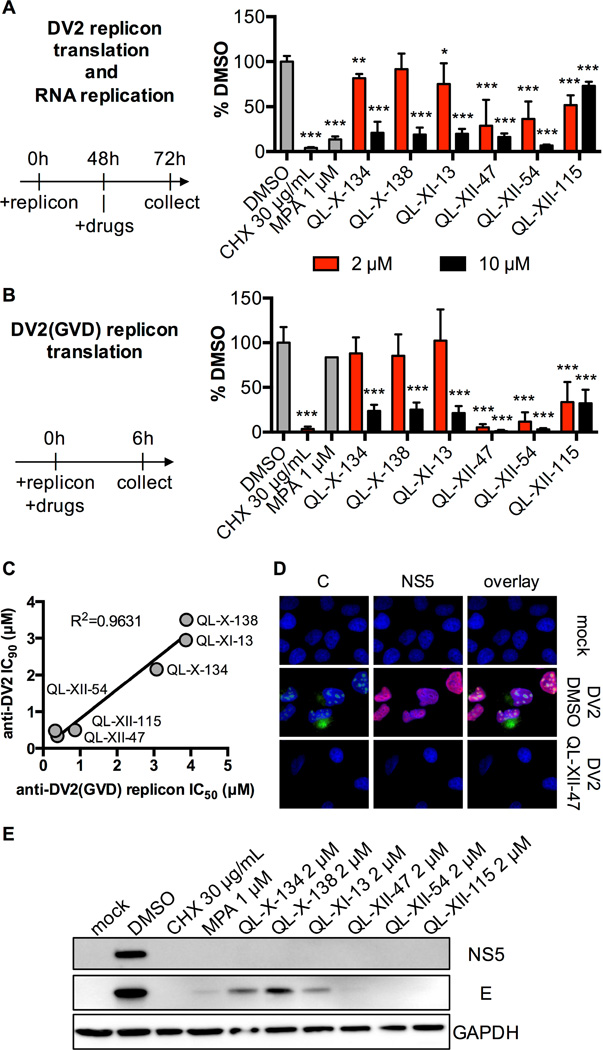
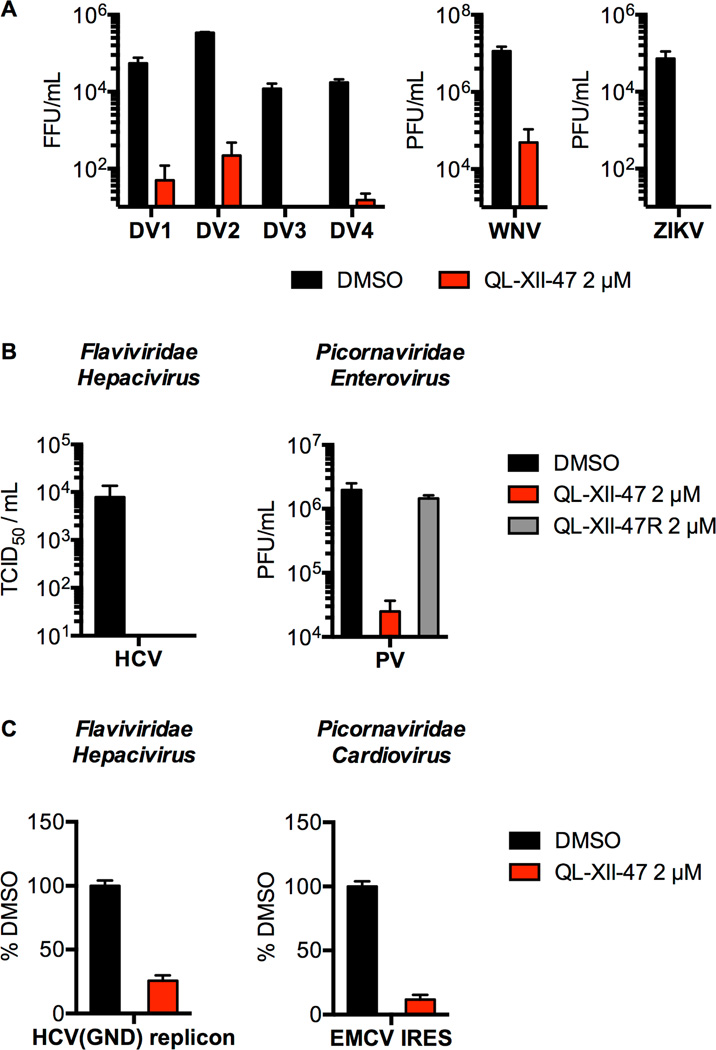
We report here on an approach targeting the host reactive cysteinome to identify inhibitors of host factors required for the infectious cycle of Flaviviruses and other viruses. We used two parallel cellular phenotypic screens to identify a series of covalent inhibitors, exemplified by QL-XII-47, that are active against dengue virus. We show that the compounds effectively block viral protein expression and that this inhibition is associated with repression of downstream processes of the infectious cycle, and thus significantly contributes to the potent antiviral activity of these compounds. We demonstrate that QL-XII-47's antiviral activity requires selective, covalent modification of a host target by showing that the compound's antiviral activity is recapitulated when cells are preincubated with QL-XII-47 and then washed prior to viral infection and by showing that QL-XII-47R, a non-reactive analog, lacks antiviral activity at concentrations more than 20-fold higher than QL-XII-47's IC90. QL-XII-47's inhibition of Zika virus, West Nile virus, hepatitis C virus, and poliovirus further suggests that it acts via a target mediating inhibition of these other medically relevant viruses. These results demonstrate the utility of screens targeting the host reactive cysteinome for rapid identification of compounds with potent antiviral activity.


Figures

Figure 1
Figure 1. Description of the screens that led to the identification of covalent inhibitors of DV2
A. In the reporter viral particles (RVP) screen, Huh7 cells were treated with a subset of 250 compounds (final concentration 1.9 µM), then infected with DV2 RVP. Renilla luciferase signal encoded by the WNV replicon was measured in cells at 24 hours post-infection. B. In the replicon screen, T-REx-293-DGZ cells were pre-treated for 48 hours with 0.5 µM mycophenolic acid (MPA), then treated with a subset of 288 compounds (final concentration 3.3 µM) for 48 hours after which GFP signal encoded by the DV2 replicon was measured. C. Data for both screens (light grey circles for RVP; dark grey triangles for replicon) are plotted as a percentage of the DMSO-treated cells with background values set as the signal from mock-infected cells for the RVP screen and signal from cells treated with 10 µM MPA for the replicon screen. Molecules causing an inhibition of signal > 50% were identified as “hits” (the 50% selection cut-off is represented as a red dotted line). The compounds are distributed into 5 groups along the x axis based on their core structure (shown below the axis): 1 – purine; 2 – pyrimidine; 3 – pyrazolopyrimidine; 4 – pyrrolopyrimidine; 5 – quinoline. The remaining 56 compounds include various structures and are grouped under “others”. The quinoline compounds further studied in the present work are identified by red symbols. QL-XII-47 is identified by a crossed-out symbol.
Figure 2
Figure 2. QL-XII-47 and related quinolines do not affect viral entry
A. In time-of-addition studies, Huh7 cells were infected with DV2 at MOI of 1. The cells were treated with 2 µM of small molecules concomitant with the infection (co), post-infection (post), or at both times (co+post). The infectious virus released to the supernatants at 24 hours post-infection was quantified by FFA. Representative data (mean ±standard deviation of experimental duplicates) out of n=2 independent experiments are shown. B. To monitor the DV2 genomic RNA, Huh7 cells were mock-infected, or infected with DV2 at a MOI of 10 for 1 hour and then treated with DMSO or 2 µM of QL-XII-47. Cover slips were collected at the indicated times post-infection, and DV2 RNA was detected by in situ hybridization assays (in red). Nuclei were stained with 4’,6-diamidino-2-phenylindole (DAPI, in blue). Representative images taken at 400x magnification from one of n>3 independent experiments are shown. C. To quantify the abundance of intracellular DV2 RNA, Huh7 cells were mock- infected, infected with DV2 at a MOI of 1 for 1 hour and then were treated with DMSO or 2 µM of QL-XII-47. Control cells were infected with DV2 that had been pretreated with DV2419-447 (5 µM, 37°C, 15 min). Total RNA was collected at the indicated times post-infection, and DV2 RNA was quantified by RT-qPCR. The results were normalized to GAPDH mRNA and are expressed as fold increase over mock-infected controls. Representative data (mean ±standard deviation of experimental duplicates) out of n=2 independent experiments are shown.
Figure 3
Figure 3. QL-XII-47 and related quinolines block translation of the DV2 RNA
A. Huh7 cells were electroporated with a DV2 reporter replicon and treated with inhibitors at 48 hours post-electroporation. Luciferase activity was quantified at 72 h post-electroporation and is plotted as a percentage of the DMSO-treated samples. Mean values and standard deviation from n=3 independent experiments are shown. B. Huh7 cells were transfected with a DV2(GVD) reporter replicon, and immediately treated with compounds. Luciferase activity was quantified at 6 hours post-transfection and is plotted as a percentage of the DMSO-treated samples. Mean values and standard deviation from n=3 independent experiments are shown. C. The assay described in panel B was used to determine IC50 of each small molecule against the DV2(GVD) replicon. Cells were treated with a range of small molecules concentrations, and the concentrations that lead to 50% inhibition in firefly luciferase signal (IC50) were calculated using the nonlinear fit variable slope model (GraphPad Software). IC90 values obtained against the infectious virus in Table 1 and Figure S1 were plotted versus the IC50 values for inhibition of viral translation in the DV2(GVD) replicon assay, and the resulting curve was fit by linear regression to illustrate correlation of antiviral potency and inhibition of translation. D. Huh7 cells were mock infected or infected with DV2 (MOI of 10) for 1 hour and then were treated with DMSO or 2 µM QL-XII-47. Cover slips were collected at 24 hours post-infection and stained for the DV2 C (in green) and NS5 (in red) proteins. Nuclei were stained with DAPI (in blue). The images were taken at 400x magnification, and representative images from n>3 independent experiments are shown. E. Huh7 cells were mock-infected or infected with DV2 (MOI of 1) for 1 hour, and then treated with inhibitors at a final concentration of 2 µM. At 24 hours post- infection, the cell lysates were collected and analyzed for the presence of DV2 E and NS5 proteins, as well as for the presence of GAPDH by Western blotting. A representative experiment out of n=2 repeats is shown.
Figure 4
Figure 4. The acrylamide moiety is required for the antiviral activity of QL-XII-47
A. Huh7 cells were pre-treated with 2 µM QL-XII-47 for 6 hours and then washed prior to DV2 infection (MOI of 1) (pre-treat), or were treated with 2 µM QL-XII-47 for 24 hours post-infection (post-treat). Infectious virus released to the supernatants at 24 hours post-infection was quantified by FFA. Representative data (mean ±standard deviation of experimental duplicates) out of n=2 independent experiments are shown. B. Huh7 cells were pre-treated with 2 μM QL-XII-47 for 6 hours and then washed prior to transfection (pre-treat) or were treated with 2 µM QL-XII-47 for 12 hours starting at the time of transfection (post-treat) with a DV2(GVD) reporter replicon. Luciferase activity was quantified at 12 hours post-transfection and is plotted as a percentage of the DMSO-treated samples. Representative data (mean ± standard deviation of experimental duplicates) out of n=2 independent experiments are shown. C. Structures of parent compound QL-XII-47 and QL-XII-47R, a derivative in which the acrylamide moiety is replaced with a non-reactive propyl amide group. D. The concentration-dependent effects of QL-XII-47 and QL-XII-47R were assessed by infection of Huh7 cells with DV2 (MOI of 1) followed by addition of inhibitors. Viral yield was measured 24 hours later and is plotted as a percentage of the DMSO control. Representative data (mean ± standard deviation of experimental duplicates) from n≥2 independent experiments are shown. E. Huh7 cells were infected with DV2 (MOI of 1), then treated with the indicated compounds. Infectious virus released to the supernatants at 24 hours post- infection was quantified by FFA. Representative data (mean ± standard deviation of experimental duplicates) out of n>2 independent experiments are shown. The chemical structure of each molecule is shown on the side of the graph.
Figure 5
Figure 5. QL-XII-47 exhibits broad antiviral activity
A. Huh7 cells were infected with DV1, DV2, DV3, DV4, WNV, or ZIKV at MOI of 1, then treated with 2 µM of QL-XII-47. Infectious virus released to the supernatants at 24 hours post-infection was quantified by FFA (DV), or plaque- formation assay (PFA) (WNV and ZIKV). PFU, plaque-forming unit. Representative data (mean ± standard deviation of experimental duplicates) out of n=2 independent experiments are shown. B. For HCV, Huh7 cells were infected at MOI of 1, and treated with 2 µM of QL- XII-47. Infectious virus released to the supernatants at 24 hours post-infection was quantified by TCID50 assay. For PV, HeLa cells were infected at a MOI of 0.75, and treated with 2 µM of QL-XII-47 or QL-XII-47R. The infectious virus released to the supernatants at 8 hours post-infection was quantified by PFA. Representative data (mean ± standard deviation of experimental duplicates) out of n≥2 independent experiments are shown. C. Huh7 cells were transfected with a HCV(GND) reporter replicon or with a EMCV IRES reporter RNA, and immediately treated with 2 µM of QL-XII-47. The luciferase activity was quantified at 6 hours post-transfection and is plotted as a percentage of the DMSO-treated samples. Representative data (mean ± standard deviation of experimental duplicates) out of n≥2 independent experiments are shown.

References

    1. Ang F, Wong AP, Ng MM, Chu JJ. Small interference RNA profiling reveals the essential role of human membrane trafficking genes in mediating the infectious entry of dengue virus. Virology journal. 2010;7:24. - PMC - PubMed
    1. Ansarah-Sobrinho C, Nelson S, Jost CA, Whitehead SS, Pierson TC. Temperature-dependent production of pseudoinfectious dengue reporter virus particles by complementation. Virology. 2008;381:67–74. - PMC - PubMed
    1. Backus KM, Correia BE, Lum KM, Forli S, Horning BD, Gonzalez-Paez GE, Chatterjee S, Lanning BR, Teijaro JR, Olson AJ, Wolan DW, Cravatt BF. Proteome-wide covalent ligand discovery in native biological systems. Nature. 2016;534:570–574. - PMC - PubMed
    1. Bekerman E, Einav S. Infectious disease. Combating emerging viral threats. Science. 2015;348:282–283. - PMC - PubMed
    1. Bhatt S, Gething PW, Brady OJ, Messina JP, Farlow AW, Moyes CL, Drake JM, Brownstein JS, Hoen AG, Sankoh O, Myers MF, George DB, Jaenisch T, Wint GR, Simmons CP, Scott TW, Farrar JJ, Hay SI. The global distribution and burden of dengue. Nature. 2013;496:504–507. - PMC - PubMed

MeSH terms

Substances