

Insulin resistance in Alzheimer's disease
- PMID: 28034760
- PMCID: PMC5393926
- DOI: 10.1016/j.trsl.2016.12.005
Insulin resistance in Alzheimer's disease
Abstract
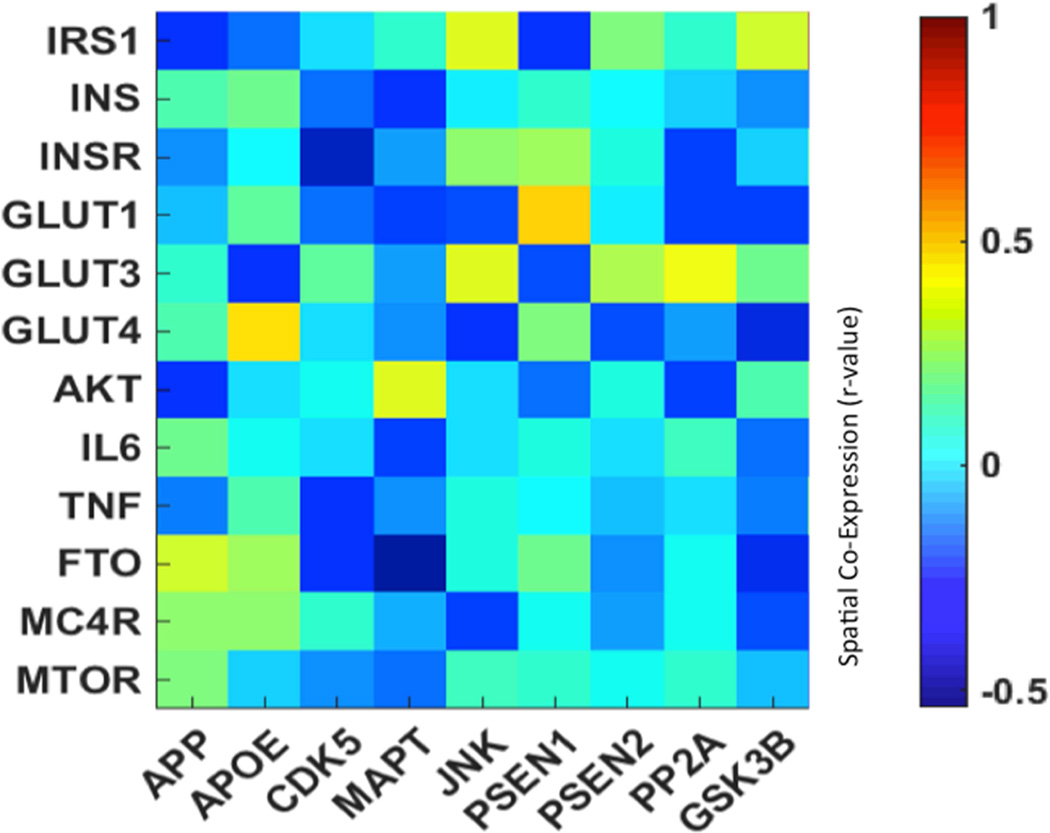
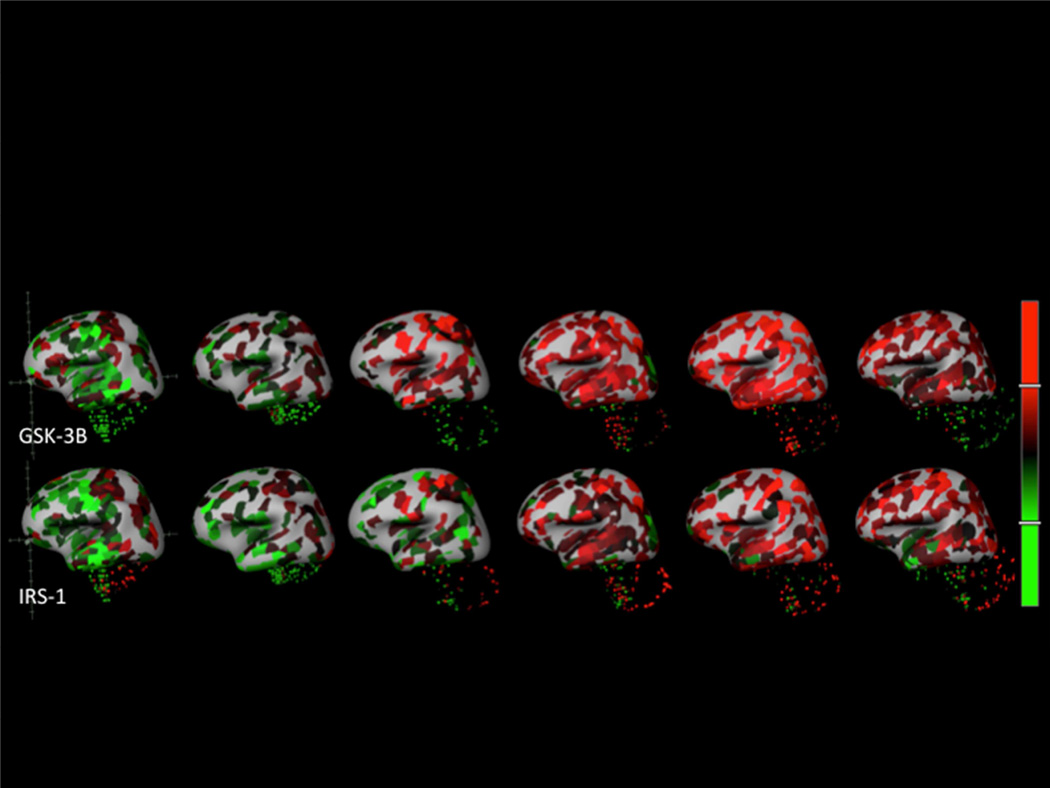
The links between systemic insulin resistance (IR), brain-specific IR, and Alzheimer's disease (AD) have been an extremely productive area of current research. This review will cover the fundamentals and pathways leading to IR, its connection to AD via cellular mechanisms, the most prominent methods and models used to examine it, an introduction to the role of extracellular vesicles (EVs) as a source of biomarkers for IR and AD, and an overview of modern clinical studies on the subject. To provide additional context, we also present a novel analysis of the spatial correlation of gene expression in the brain with the aid of Allen Human Brain Atlas data. Ultimately, examining the relation between IR and AD can be seen as a means of advancing the understanding of both disease states, with IR being a promising target for therapeutic strategies in AD treatment. In conclusion, we highlight the therapeutic potential of targeting brain IR in AD and the main strategies to pursue this goal.
Published by Elsevier Inc.
Conflict of interest statement
Conflicts of Interest: All authors have read the journal’s policy on disclosure of potential conflicts of interest and have none to declare.
Figures
References
-
- Leney SE, Tavare JM. The molecular basis of insulin-stimulated glucose uptake: signalling, trafficking and potential drug targets. J Endocrinol. 2009;203:1–18. - PubMed
-
- Draznin B. Molecular mechanisms of insulin resistance: serine phosphorylation of insulin receptor substrate-1 and increased expression of p85alpha: the two sides of a coin. Diabetes. 2006;55:2392–2397. - PubMed
-
- Sarbassov DD, Guertin DA, Ali SM, Sabatini DM. Phosphorylation and regulation of Akt/PKB by the rictor-mTOR complex. Science. 2005;307:1098–1101. - PubMed
Publication types
MeSH terms
Grants and funding
LinkOut - more resources
Full Text Sources
Other Literature Sources
Medical
