. 2017 Jul 15;23(14):3734-3743.
doi: 10.1158/1078-0432.CCR-16-1446. Epub 2016 Dec 29.

Comparison of Acalabrutinib, A Selective Bruton Tyrosine Kinase Inhibitor, with Ibrutinib in Chronic Lymphocytic Leukemia Cells

Affiliations

Comparison of Acalabrutinib, A Selective Bruton Tyrosine Kinase Inhibitor, with Ibrutinib in Chronic Lymphocytic Leukemia Cells

Viralkumar Patel et al. Clin Cancer Res. .

Abstract

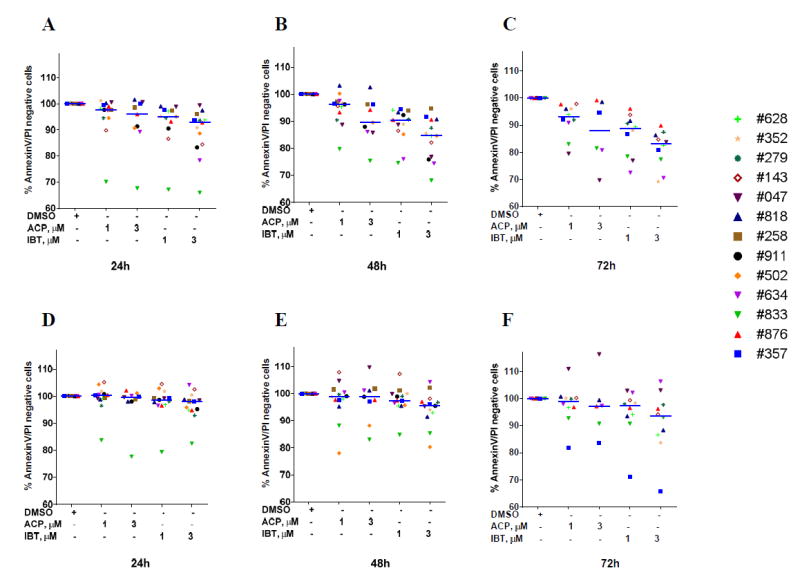
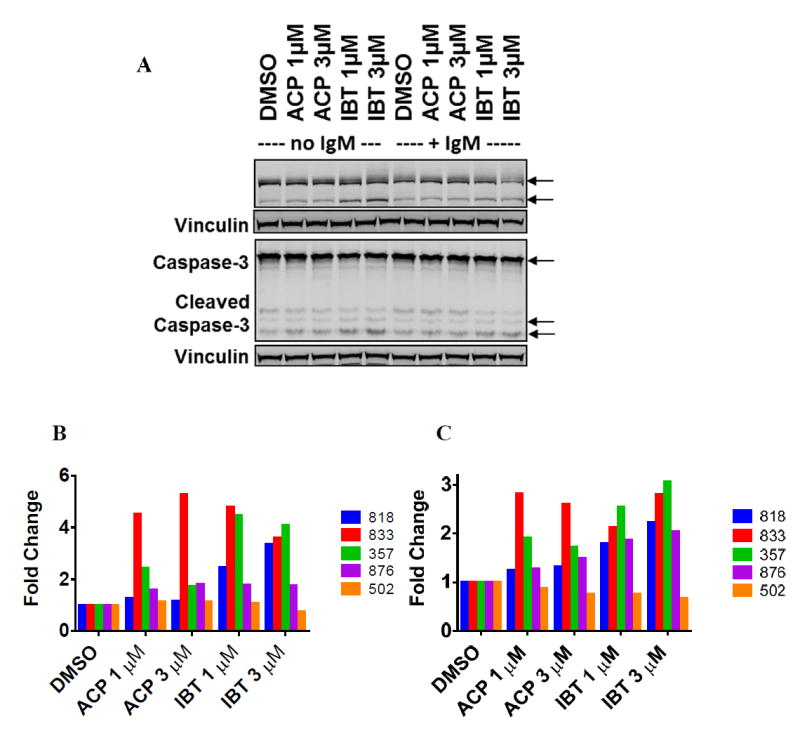
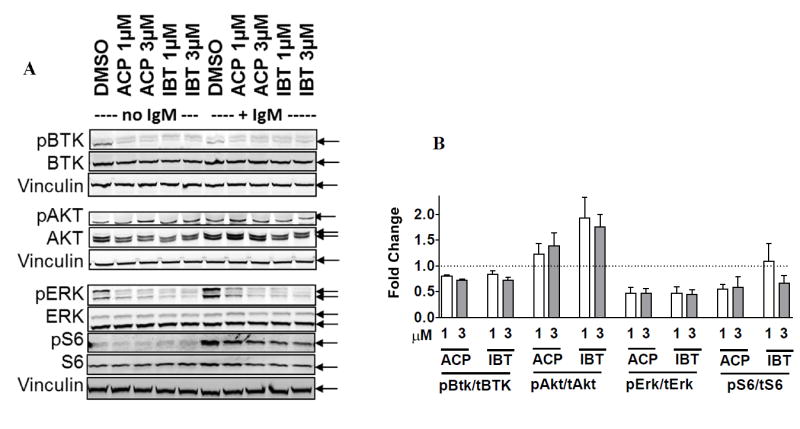
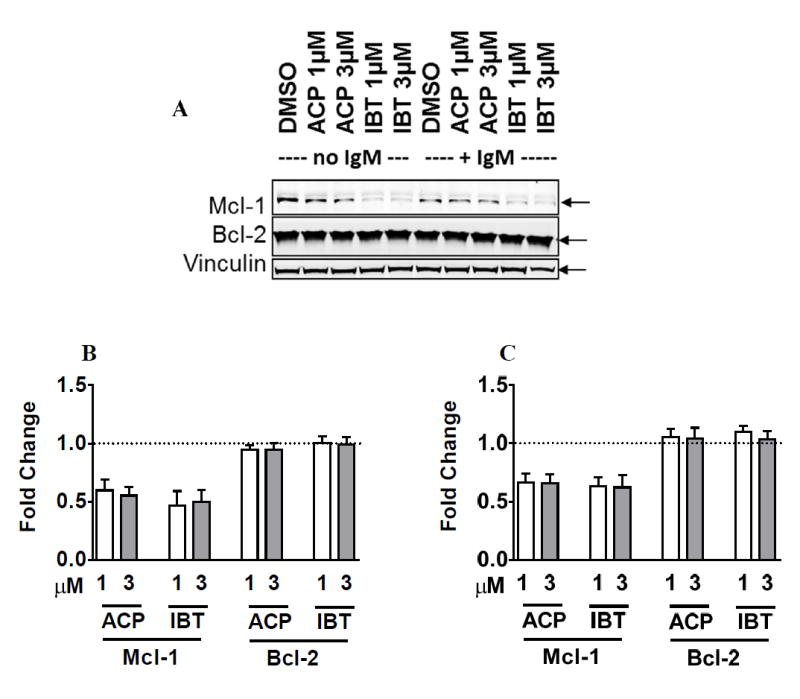
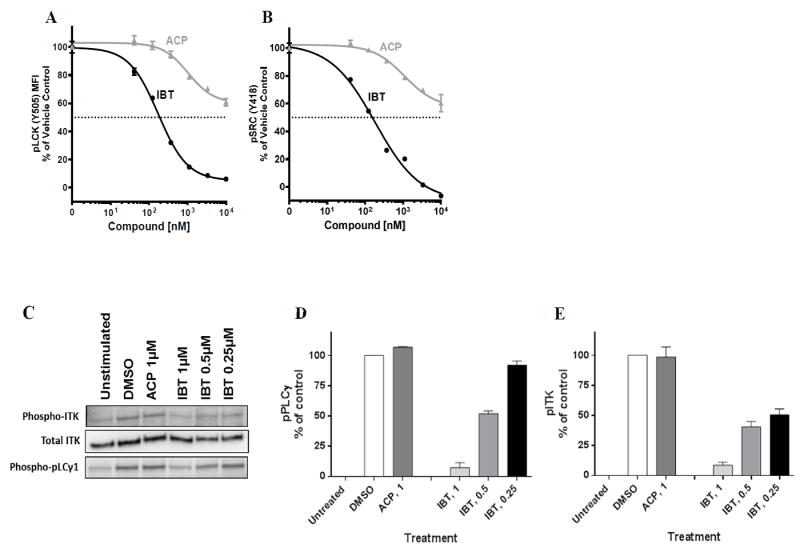
Purpose: Ibrutinib inhibits Bruton tyrosine kinase (BTK) by irreversibly binding to the Cys-481 residue in the enzyme. However, ibrutinib also inhibits several other enzymes that contain cysteine residues homologous to Cys-481 in BTK. Patients with relapsed/refractory or previously untreated chronic lymphocytic leukemia (CLL) demonstrate a high overall response rate to ibrutinib with prolonged survival. Acalabrutinib, a selective BTK inhibitor developed to minimize off-target activity, has shown promising overall response rates in patients with relapsed/refractory CLL. A head-to-head comparison of ibrutinib and acalabrutinib in CLL cell cultures and healthy T cells is needed to understand preclinical biologic and molecular effects.Experimental Design: Using samples from patients with CLL, we compared the effects of both BTK inhibitors on biologic activity, chemokine production, cell migration, BTK phosphorylation, and downstream signaling in primary CLL lymphocytes and on normal T-cell signaling to determine the effects on other kinases.Results: Both BTK inhibitors induced modest cell death accompanied by cleavage of PARP and caspase-3. Production of CCL3 and CCL4 chemokines and pseudoemperipolesis were inhibited by both drugs to a similar degree. These drugs also showed similar inhibitory effects on the phosphorylation of BTK and downstream S6 and ERK kinases. In contrast, off-target effects on SRC-family kinases were more pronounced with ibrutinib than acalabrutinib in healthy T lymphocytes.Conclusions: Both BTK inhibitors show similar biological and molecular profile in primary CLL cells but appear different on their effect on normal T cells. Clin Cancer Res; 23(14); 3734-43. ©2016 AACR.


Conflict of interest statement

Conflict-of-interest disclosure

V.G. and W.G.W. received research and clinical trial funding from Acerta Pharma. E.B. is an employee of Acerta Pharma. The other authors do not have conflicts of interest.

Figures

Figure 1
Figure 1. Comparison of ibrutinib and acalabrutinib-induced apoptosis and influence of BCR pathway stimulation
A-C. Dose- and time-dependent induction of apoptosis of CLL primary lymphocytes treated with ibrutinib (IBT) or acalabrutinib (ACP). Freshly isolated CLL cells from 13 patients were incubated with DMSO alone (control) or 1 μM or 3 μM IBT or ACP for 24 (A), 48 (B), or 72 (C) hours. Cells were washed and stained with annexin V and propidium iodide and analyzed by flow cytometry. To determine p values, either treated cells were compared with controls or IBT-treated were compared with ACP-treated. D-F. Impact of BCR pathway stimulation by IgM on dose- and time-dependent induction of apoptosis of CLL primary lymphocytes treated with IBT or ACP. Freshly isolated CLL cells from 13 patients were incubated with IgM followed by incubation with DMSO alone (control) or 1 μM or 3 μM IBT or ACP for 24, 48, or 72 hours. Cells were washed and stained with annexin V and propidium iodide and analyzed by flow cytometry. Each data point represents an individual patient and is denoted by a three-digit number, as shown in Supplemental Table 1.
Figure 2
Figure 2. Cell death induced by ibrutinib and acalabrutinib was associated with PARP and caspase 3 cleavage
A. Increase in PARP and caspase 3 cleavage after treatment with BTK inhibitors without IgM stimulation (lanes 1-5) and with IgM stimulation (lanes 6-10). Leukemic lymphocytes were treated with DMSO only (control) or with 1 μM or 3 μM ibrutinib or acalabrutinib for 48 hours with or without BCR pathway stimulation with IgM. The protein lysates were immunoblotted with total and cleaved PARP or caspase 3 antibodies as described in the Methods. Vinculin was used as a loading control. B and C. Immunoblots were analyzed for five patients, and cleaved PARP (B) and caspase 3 (C) bands were quantitated for CLL cells treated with BTK inhibitors without IgM stimulation. Values represent fold change relative to control.
Figure 3
Figure 3. Comparison of ibrutinib and acalabrutinib-mediated inhibition of chemokine production and pseudoemperipolesis
A-D. Effect of BTK inhibitors on CCL3 production and secretion from CLL cells. Freshly isolated CLL cells from four patients were either untreated (A-B) or stimulated with IgM (C-D). Cells were treated with DMSO or 1 μM ibrutinib (IBT) or acalabrutinib (ACP) for 24 hours. CCL3 concentrations in media were measured by enzyme-linked immunosorbent assay as described in the Methods section. Statistical analyses were performed to compare ibrutinib with acalabrutinib without IgM (p = 0.355) or with IgM (p = 0.170). E-F. Effect of BTK inhibitors on CCL4 production and secretion from CLL cells. Freshly isolated CLL cells from four patients were either untreated (E-F) or stimulated with IgM (G-H). Cells were treated with DMSO or 1 μM ibrutinib (IBT) or acalabrutinib (ACP) for 24 hours. CCL4 concentrations in media were measured by enzyme-linked immunosorbent assay as described in the Methods section. Statistical analyses were performed to compare ibrutinib with acalabrutinib without IgM (p = 0.246) or with IgM (p = 0.747). I. Impact of BTK inhibitors on pseudoemperipolesis. Primary CLL cells were treated with DMSO, acalabrutinib, or ibrutinib at different concentrations and placed on stromal cells for 4 hours. Cells were removed from the suspension. Cells that migrated under the stroma were counted. Values represent the percentage of cells that migrated relative to DMSO controls. Statistical analyses were performed to compare 1 μM ibrutinib with 1 μM acalabrutinib (p = 0.678) or 3 μM ibrutinib with 3 μM acalabrutinib (p = 0.887).
Figure 4
Figure 4. Comparison of ibrutinib- and acalabrutinib-mediated inhibition of BTK phosphorylation and downstream signaling
A. CLL cells were incubated with DMSO only (controls) or with 1 μM or 3 μM ibrutinib or acalabrutinib for 48 hours without IgM stimulation (lanes 1-5) or with IgM stimulation (lanes 6-10). The protein lysates were immunoblotted for total and phosphorylated BTK, AKT, ERK, and S6 proteins. Vinculin was used as a loading control. B. Immunoblots representing five different patient samples without IgM stimulation were quantitated. Values represent fold change in phosphorylated protein relative to total protein.
Figure 5
Figure 5. Comparison of ibrutinib and acalabrutinib-mediated changes in the levels of Bcl-2 and Mcl-1 antiapoptotic proteins
A. CLL cells were incubated with DMSO only (controls) or with 1 μM or 3 μM ibrutinib or acalabrutinib for 48 hours without IgM stimulation (lanes 1-5) or with IgM stimulation (lanes 6-10). The protein lysates were immunoblotted for total Bcl-2 and Mcl-1 proteins. Vinculin was used as a loading control. B-C. Immunoblots were analyzed from five different patients, and changes in Mcl-1 and Bcl-2 in CLL cells treated with BTK inhibitors without (B) or with (C) IgM stimulation were quantitated. Values represent fold change relative to DMSO controls.
Figure 6
Figure 6. Comparison of ibrutinib and acalabrutinib-induced signaling in T cells
Peripheral blood mononuclear cells from healthy donors were treated with indicated concentrations of BTK inhibitors for 2 hours and then stimulated with 3.3 mM H2O2 for 10 minutes at 37°C. Phosphoflow analysis for A. phospho-LCK (Y505) and B. phospho-SRC (Y418) were performed with gated CD3+ T cells. Grey lines with solid triangles represent acalabrutinib treatment, and black lines with solid circles represent ibrutinib treatment. Jurkat cells were either unstimulated, stimulated and treated with vehicle (DMSO), or stimulated and treated with acalabrutinib or ibrutinib at indicated concentrations. (C) Western blot showing phospho-ITK, total ITK, and phospho-PLCγ1 expression in Jurkat cell line before and after treatment with acalabrutinib or ibrutinib at indicated concentrations. (D-E) Quantification of immunoblots for phospho-PLCγ1 and phospho-ITK. Immunoblots in Figure 6C were quantified three times using GelQuant software and normalized to DMSO control. Abbreviations; ACP, acalabrutinib; IBT, ibrutinib. Concentrations of both drugs are in nM for Figures 6A and B and μM for Figures 6 C-E.

Similar articles

Cited by

References

    1. Stevenson FK, Caligaris-Cappio F. Chronic lymphocytic leukemia: revelations from the B-cell receptor. Blood. 2004;103(12):4389–95. doi: 10.1182/blood-2003-12-4312. - DOI - PubMed
    1. Tsukada S, Saffran DC, Rawlings DJ, Parolini O, Allen RC, Klisak I, et al. Deficient expression of a B cell cytoplasmic tyrosine kinase in human X-linked agammaglobulinemia. Cell. 1993;72(2):279–90. - PubMed
    1. Bruton OC. Agammaglobulinemia. Pediatrics. 1952;9(6):722–8. - PubMed
    1. Buckley RH. Primary immunodeficiency diseases due to defects in lymphocytes. The New England journal of medicine. 2000;343(18):1313–24. doi: 10.1056/NEJM200011023431806. - DOI - PubMed
    1. Zhu Q, Zhang M, Winkelstein J, Chen SH, Ochs HD. Unique mutations of Bruton’s tyrosine kinase in fourteen unrelated X-linked agammaglobulinemia families. Human molecular genetics. 1994;3(10):1899–900. - PubMed

MeSH terms