. 2017 Jan 17;114(3):492-497.
doi: 10.1073/pnas.1613855114. Epub 2016 Dec 29.

Matrix stiffening promotes a tumor vasculature phenotype

Affiliations

Matrix stiffening promotes a tumor vasculature phenotype

Francois Bordeleau et al. Proc Natl Acad Sci U S A. .

Abstract

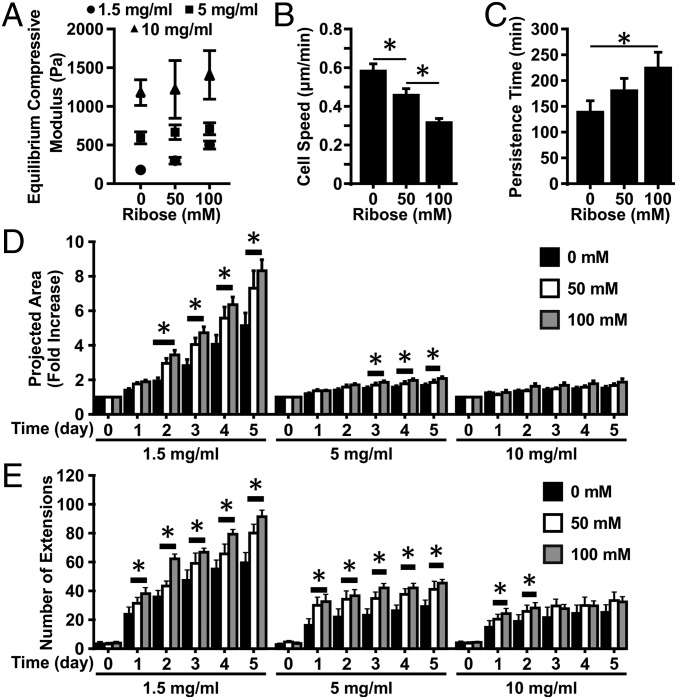
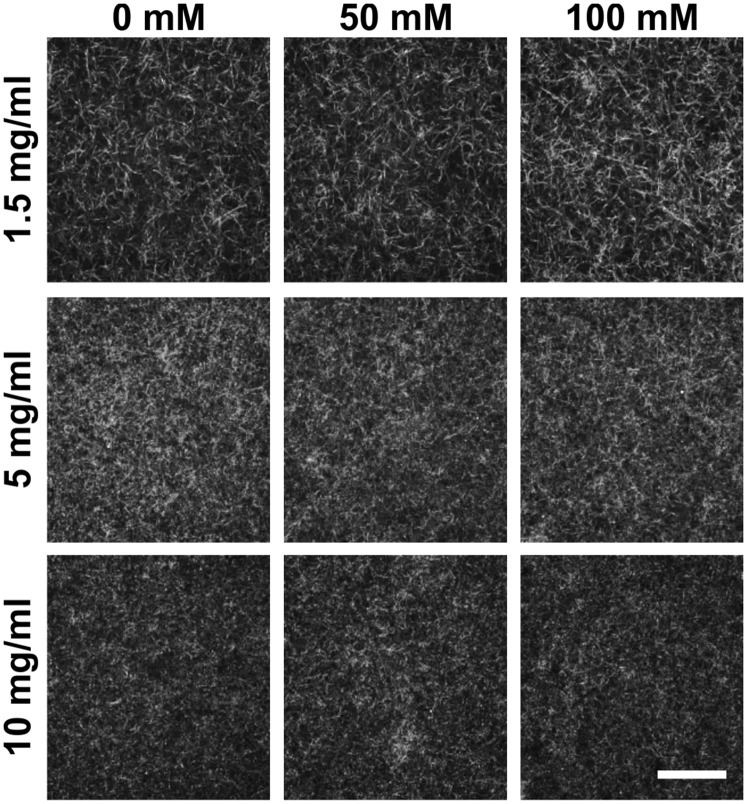
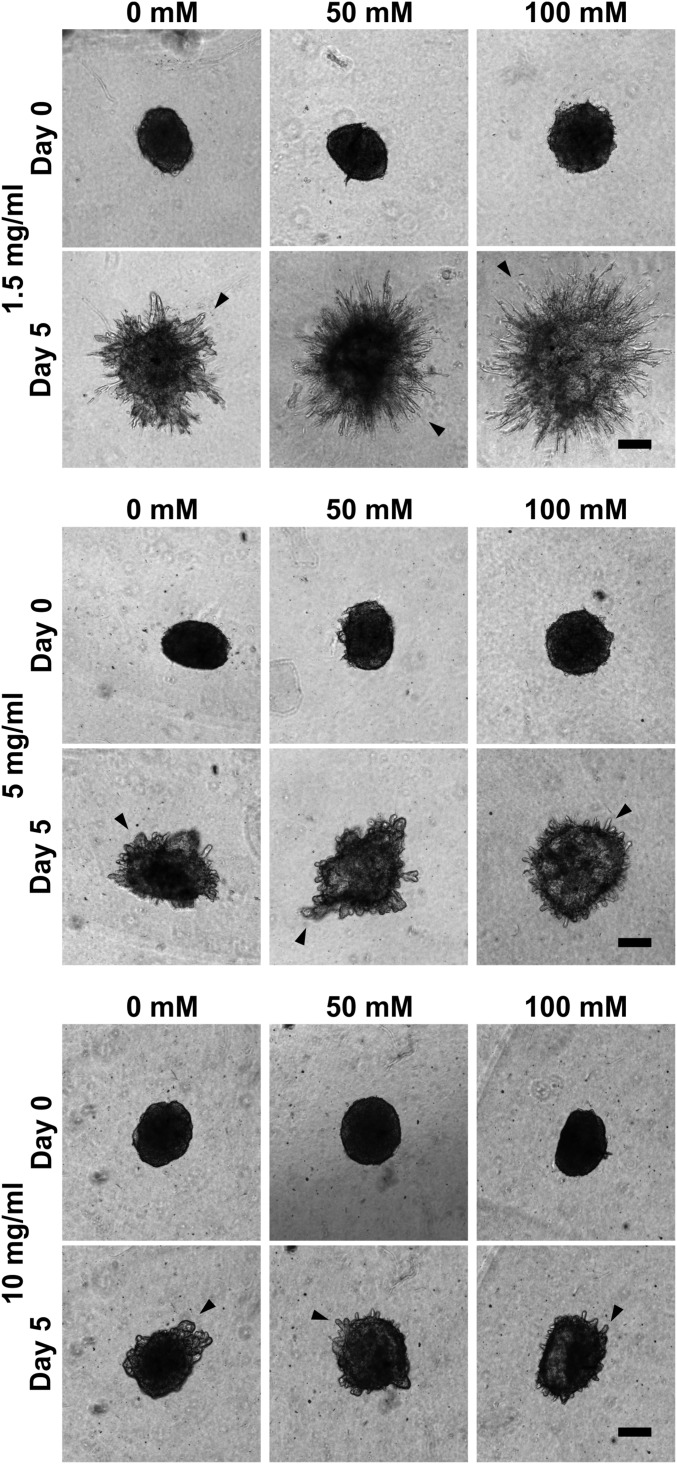
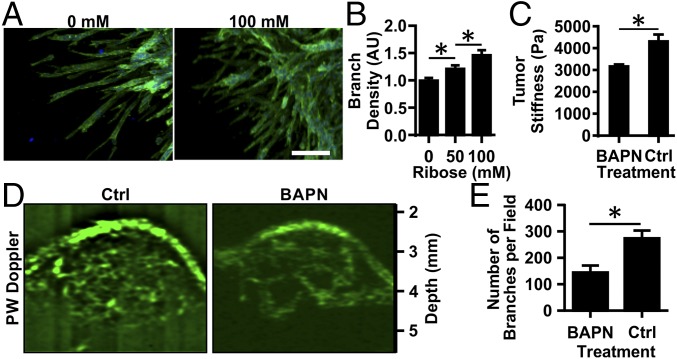
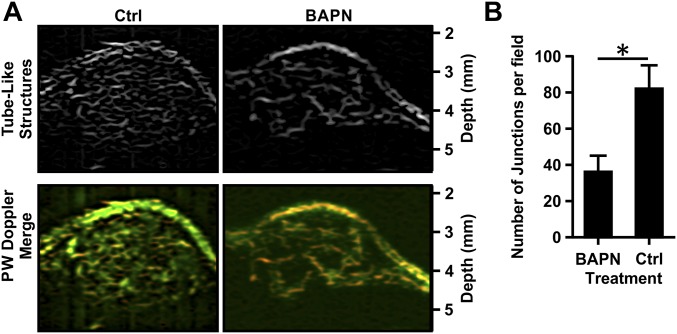
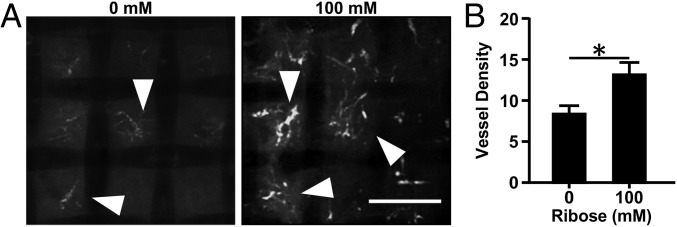
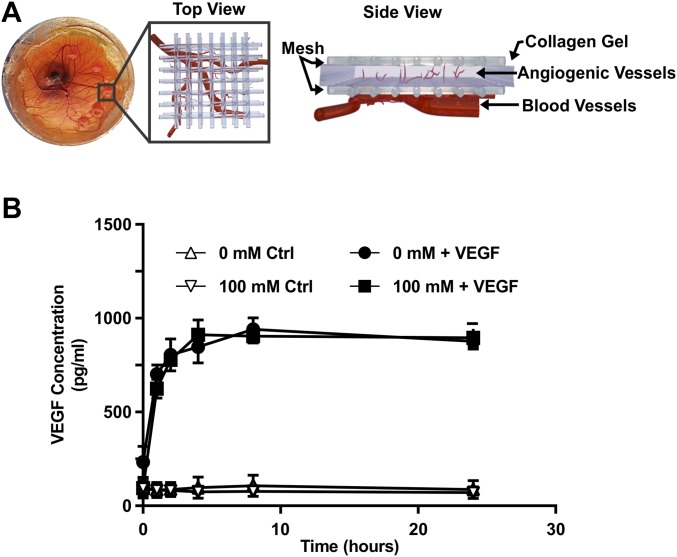
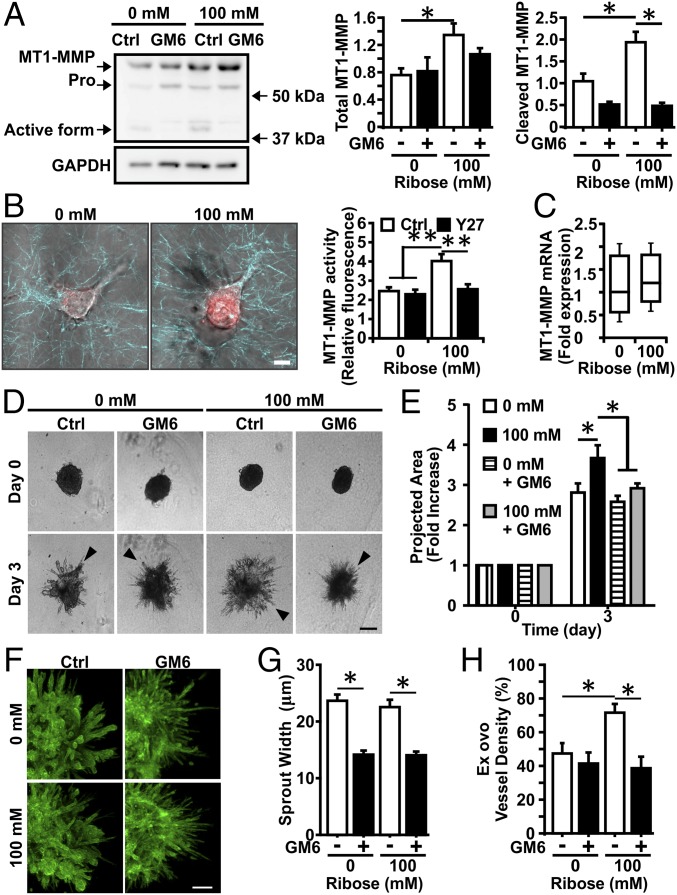
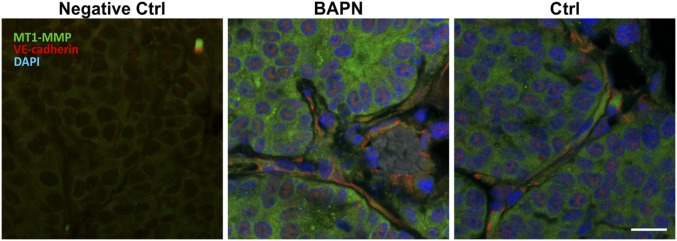
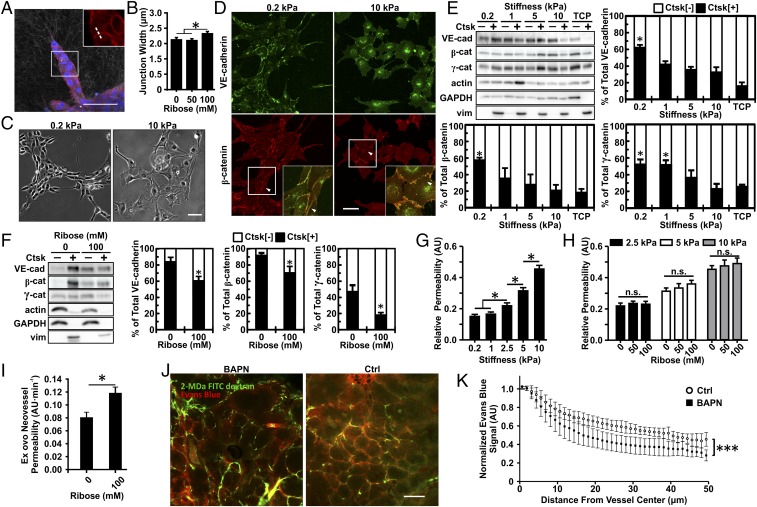
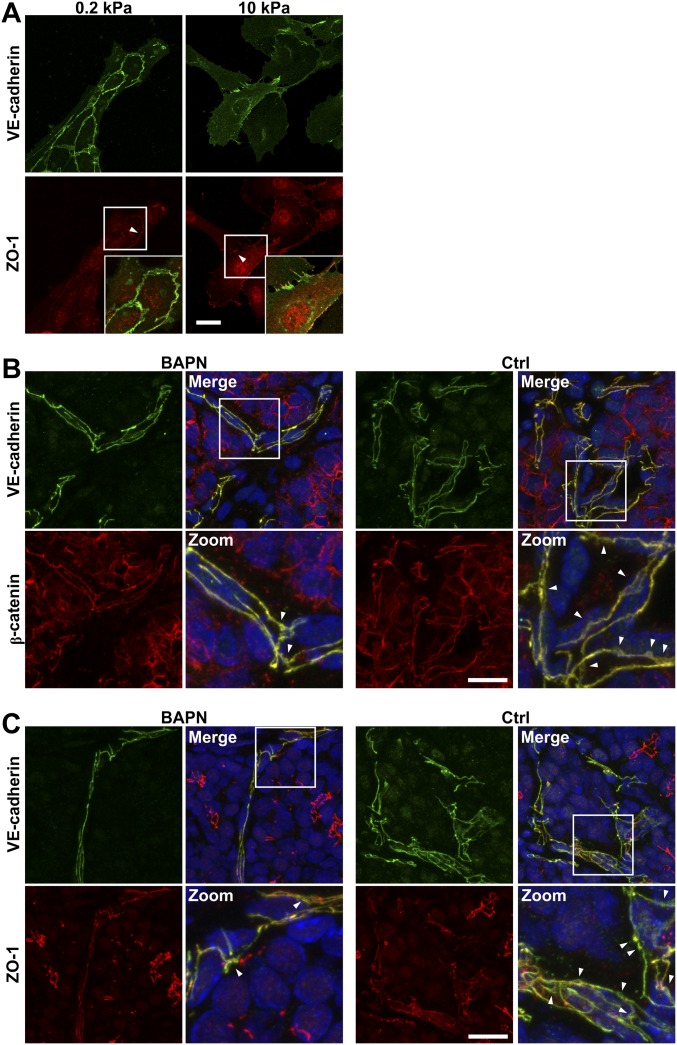
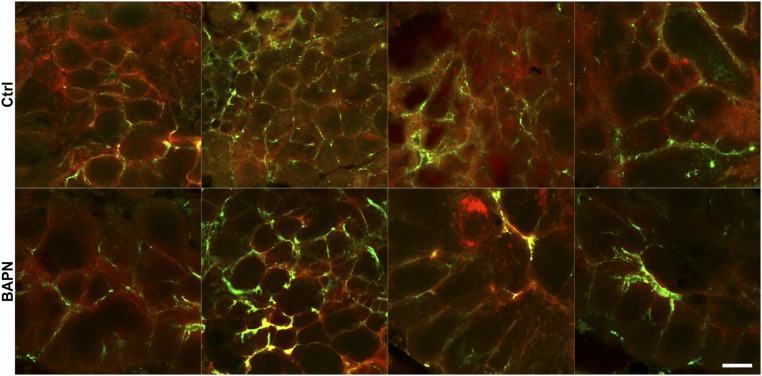
Tumor microvasculature tends to be malformed, more permeable, and more tortuous than vessels in healthy tissue, effects that have been largely attributed to up-regulated VEGF expression. However, tumor tissue tends to stiffen during solid tumor progression, and tissue stiffness is known to alter cell behaviors including proliferation, migration, and cell-cell adhesion, which are all requisite for angiogenesis. Using in vitro, in vivo, and ex ovo models, we investigated the effects of matrix stiffness on vessel growth and integrity during angiogenesis. Our data indicate that angiogenic outgrowth, invasion, and neovessel branching increase with matrix cross-linking. These effects are caused by increased matrix stiffness independent of matrix density, because increased matrix density results in decreased angiogenesis. Notably, matrix stiffness up-regulates matrix metalloproteinase (MMP) activity, and inhibiting MMPs significantly reduces angiogenic outgrowth in stiffer cross-linked gels. To investigate the functional significance of altered endothelial cell behavior in response to matrix stiffness, we measured endothelial cell barrier function on substrates mimicking the stiffness of healthy and tumor tissue. Our data indicate that barrier function is impaired and the localization of vascular endothelial cadherin is altered as function of matrix stiffness. These results demonstrate that matrix stiffness, separately from matrix density, can alter vascular growth and integrity, mimicking the changes that exist in tumor vasculature. These data suggest that therapeutically targeting tumor stiffness or the endothelial cell response to tumor stiffening may help restore vessel structure, minimize metastasis, and aid in drug delivery.

Keywords: endothelial cells; extracellular matrix; glycation; tumor stiffness; vascular permeability.


Conflict of interest statement

The authors declare no conflict of interest.

Figures

Fig. 1.
Fig. 1.
Matrix density and cross-linking alter collagen gel mechanical properties and the angiogenic sprouting response from multicellular spheroids. (A) Equilibrium compressive moduli of 1-, 5-, and 10-mg/mL collagen gel following cross-linking with 0, 50, or 100 mM ribose. (B and C) Quantification of migration speed (B) and persistence (C) for ECs embedded within 1.5-mg/mL collagen gels glycated with 0, 50, or 100 mM ribose. (D and E) The projected spheroid area (D) and the number of extensions (E) were measured over the course of 5 d. Data are presented as mean ± SEM; *P < 0.05.
Fig. S1.
Fig. S1.
Matrix density and cross-linking alter collagen fiber arrangement. Confocal reflectance microscopy images of 1-, 5-, and 10-mg/mL collagen gel following cross-linking with 0, 50, or 100 mM ribose. (Scale bar, 50 μm.)
Fig. S2.
Fig. S2.
Matrix density and cross-linking alter the angiogenic sprouting response from multicellular spheroids. EC spheroids were embedded within 1.5-, 5-, or 10-mg/mL collagen gels glycated with 0, 50, or 100 mM ribose, and the angiogenic sprouting response (arrowheads) was monitored. (Scale bars, 200 μm.)
Fig. 2.
Fig. 2.
Matrix cross-linking alters angiogenic branching in vitro and in vivo. EC multicellular spheroids were embedded within 1.5-mg/mL collagen gels glycated with 0, 50, or 100 mM ribose. (A) Spheroids were fixed, stained for actin (green) and nuclei (blue), and imaged using confocal microscopy after 5 d. (Scale bar, 100 μm.) (B) The number of branches per sprout length was counted, and data were normalized to the 0-mM ribose condition. AU, arbitrary units. (C) MMTV-PyMT mice were treated with BAPN to prevent collagen cross-linking or with vehicle (controls; Ctrl), and the equilibrium compressive moduli were measured using unconfined compression testing. (D) The tumor vasculature was visualized using ultrasound. (E) The number of visible vascular branches was quantified using the ImageJ Tubeness plugin. Data are presented as mean + SEM; *P < 0.05.
Fig. S3.
Fig. S3.
Vasculature quantification using ImageJ skeletonization. (A) To quantify the tumor vasculature, ultrasound images obtained in the power wave (PW) Doppler mode (shown in the merged overlay) were processed using the ImageJ Tubeness plugin to obtain the tube-like structures for MMTV-PyMT mice treated with BAPN or vehicle (Ctrl). (B) Corresponding quantification of the number of junctional nodes, including the starting and ending nodes of each branch network, present within the vascular network within the field of view. Data are presented as mean + SEM; *P < 0.05.
Fig. 3.
Fig. 3.
Matrix cross-linking alters angiogenic sprouting into collagen gels in the chick CAM model. Angiogenic sprouting (arrowheads) into 1.5-mg/mL collagen gels glycated with 0 or 100 mM ribose were imaged with confocal microscopy (A), and the vessel density per gel was quantified (B). (Scale bar, 200 μm.) Data are presented as mean + SEM; *P < 0.05.
Fig. S4.
Fig. S4.
Collagen gel construct for the chick CAM model. (A) Representative picture of the collagen gel–nylon mesh constructs placed on the chick CAM along with schematic views (top and side) of the angiogenic ingrowth into the collagen gels from the vasculature underlying the CAM. (B) ELISA quantification of the VEGF released from collagen construct glycated with 0 or 100 mM ribose over a 24-h time course.
Fig. 4.
Fig. 4.
Stiffness-mediated angiogenic outgrowth requires MMP activity. (A, Left) Western blot for MT1-MMP in ECs embedded within 1.5-mg/mL collagen gels glycated with 0 or 100 mM ribose and fed with complete medium with (GM6) or without (Ctrl) 5 μM GM6001. (Right) The corresponding densitometric quantification normalized to actin content. GAPDH was used as loading control. (B, Left) Confocal images showing MT1-MMP activity in ECs embedded within 1.5-mg/mL collagen gels glycated with 0 or 100 mM ribose. (Right) The corresponding quantification with (Y27) or without (Ctrl) 10 μM of the ROCK inhibitor Y27632. (Scale bar, 10 μm.) (C) MT1-MMP expression determined by quantitative real-time RT-PCR does not show expression differences as a function of increased stiffness. (D) EC multicellular spheroids were embedded within 1.5-mg/mL collagen gels glycated with 0 or 100 mM ribose and fed with complete medium with (GM6) or without (Ctrl) 5 μM GM6001. (Scale bar, 200 μm.) (E) Spheroid outgrowth was quantified after 3 d of culture and normalized to the day 0 condition. (F) Spheroids were stained for actin (green) and nuclei (blue) and were imaged with confocal microscopy. (Scale bar, 100 μm.) (G) The width of angiogenic sprouts was measured by fitting the intensity profile of a line drawn perpendicular to the sprout with a two-Gaussian curve. (H) Quantification of vessel density into 1.5-mg/mL collagen gels glycated with 0 or 100 mM ribose during the CAM angiogenic sprouting assay with or without 5 μM GM6001. Data are presented as mean + SEM; *P < 0.05.
Fig. S5.
Fig. S5.
MT1-MMP expression in mammary tumors. Confocal images of MT1-MMP– and VE-cadherin–stained frozen tissue sections from mice treated with BAPN or vehicle controls (Ctrl). (Scale bar, 50 μm.)
Fig. 5.
Fig. 5.
Matrix stiffness alters VE-cadherin expression, junction width, and endothelial cell permeability. (A) EC spheroids were fixed 24 h after embedding within 1.5-mg/mL collagen gels glycated with 0, 50, or 100 mM ribose and were imaged with confocal microscopy to visualize VE-cadherin (red) and nuclei (blue) with confocal reflectance of the collagen fibers. The zoomed-in insert shows a representative region used to obtain the VE-cadherin junction width profiles from a line perpendicular to the junction (dotted line). (B) Corresponding quantification of the width of junctions between stalk cells of the sprouts. (C and D) Phase-contrast images showing ECs seeded on compliant (0.2 kPa) or stiff (10 kPa) PA substrates (C) along with the corresponding VE-cadherin and β-catenin localization at cell–cell junctions (arrowheads) showing a continuous distribution on compliant matrix and a punctate distribution on stiff matrix (D). Insets are magnifications of boxed regions. (E and F) Western blot and corresponding quantification of VE-cadherin, β-catenin, and γ-catenin content in the soluble fraction (Ctsk[−]) versus the cytoskeleton-associated insoluble fraction (Ctsk[+]) for ECs seeded on PA 2D substrate (E) or ECs embedded within 1.5-mg/mL collagen gels glycated with 0 or 100 mM ribose (F). Vimentin was used as the insoluble Ctsk[+] fraction control. TCP, tissue culture plastic. (G and H) Quantification of the EC monolayer permeability to 40-kDa FITC-dextran in response to matrix stiffness (G) and collagen glycation (H). (I) Quantification of the neovessel permeability in the CAM angiogenic sprouting assay in 1.5-mg/mL collagen gels glycated with 0 or 100 mM ribose. (J) Representative confocal images from MMTV-PyMT mice treated with BAPN or vehicle controls (Ctrl) showing 2-MDa FITC-dextran–labeled vasculature (green) and extravasating Evans blue (red). (K) Quantification of vessel permeability to Evans blue with BAPN or vehicle controls (Ctrl). (Scale bars, 50 μm.) Data are presented as mean ± SEM; *P < 0.05, ***P < 0.0001.
Fig. S6.
Fig. S6.
Matrix stiffness alters cell–cell junction organization. (A) Confocal images showing ECs seeded on compliant (0.2 kPa) or stiff (10 kPa) PA substrates stained for VE-cadherin and ZO-1 showing a continuous distribution on compliant matrix and a punctate distribution on stiff matrix. Insets are magnifications of the boxed regions. (Scale bars, 50 μm.) (B and C) Confocal images from MMTV-PyMT mice treated with BAPN or vehicle controls (Ctrl) showing increased diffuse staining (arrowheads) of VE-cadherin, β-catenin, and ZO-1 in stiffer tumor. Zoomed images are magnifications of the boxed regions. (Scale bars, 20 μm.)
Fig. S7.
Fig. S7.
In vivo permeability in MMTV-PyMT mice. Confocal images from MMTV-PyMT mice treated with BAPN or vehicle controls (Ctrl) showing 2 MDa FITC-dextran–labeled vasculature (green) and extravasating Evans blue (red). Each image is from a different mouse. (Scale bar, 50 μm.)
Fig. S8.
Fig. S8.
BAPN does not influence ECs in vitro. (A) Quantification of the permeability of the EC monolayer to 40-kDa FITC-dextran in the presence of 50- or 100-ng/mL BAPN. (B) 2D PCA plot of RNA-seq data indicate the clustering of gene-expression profiles arising from HUVEC cells treated with vehicle (Ctrl; circles), thrombin (4 U/mL) as positive control (triangles), or BAPN (100 ng/mL; squares) at 6 h (green) or 24 h (red). PC1 (the horizontal axis) is dominated by the treatment and accounts for 66% of variance. PC2 (the vertical axis) is dominated by the time point and accounts for 10% of variance. (C) Volcano plot indicating statistically significant changes in gene expression for BAPN at 6 h and 24 h (Upper) and thrombin at 6 h and 24 h (Lower). The horizontal axis indicates the log2-fold change for each treatment. The vertical axis indicates the −1 × log10 of the P value. Significant changes are indicated by red points (FDR <5%). Points for genes demonstrating a greater than fourfold increase or decrease in expression upon treatment are further labeled with their gene symbol.

Comment in

  • Matrix Biology Highlights.
    [No authors listed] [No authors listed] Matrix Biol. 2017 May;59:1-2. doi: 10.1016/j.matbio.2017.03.001. Matrix Biol. 2017. PMID: 28335831 No abstract available.

References

    1. Trédan O, Galmarini CM, Patel K, Tannock IF, Tredan O. Drug resistance and the solid tumor microenvironment. J Natl Cancer Inst. 2007;99(19):1441–1454. - PubMed
    1. Hashizume H, et al. Openings between defective endothelial cells explain tumor vessel leakiness. Am J Pathol. 2000;156(4):1363–1380. - PMC - PubMed
    1. Goel S, et al. Normalization of the vasculature for treatment of cancer and other diseases. Physiol Rev. 2011;91(3):1071–1121. - PMC - PubMed
    1. Carmeliet P. VEGF gene therapy: Stimulating angiogenesis or angioma-genesis? Nat Med. 2000;6(10):1102–1103. - PubMed
    1. Jain RK. Normalization of tumor vasculature: An emerging concept in antiangiogenic therapy. Science. 2005;307(5706):58–62. - PubMed

Publication types

MeSH terms

LinkOut - more resources