. 2017 Feb 24;292(8):3323-3340.
doi: 10.1074/jbc.M116.748699. Epub 2016 Dec 29.

Structural Insights into c-Myc-interacting Zinc Finger Protein-1 (Miz-1) Delineate Domains Required for DNA Scanning and Sequence-specific Binding

Affiliations

Structural Insights into c-Myc-interacting Zinc Finger Protein-1 (Miz-1) Delineate Domains Required for DNA Scanning and Sequence-specific Binding

Mikaël Bédard et al. J Biol Chem. .

Abstract

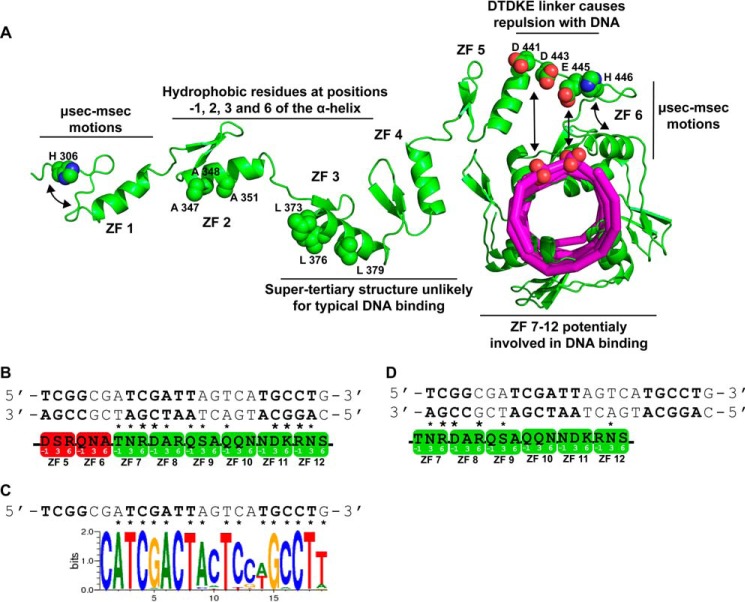
c-Myc-interacting zinc finger protein-1 (Miz-1) is a poly-Cys2His2 zinc finger (ZF) transcriptional regulator of many cell cycle genes. A Miz-1 DNA sequence consensus has recently been identified and has also unveiled Miz-1 functions in other cellular processes, underscoring its importance in the cell. Miz-1 contains 13 ZFs, but it is unknown why Miz-1 has so many ZFs and whether they recognize and bind DNA sequences in a typical fashion. Here, we used NMR to deduce the role of Miz-1 ZFs 1-4 in detecting the Miz-1 consensus sequence and preventing nonspecific DNA binding. In the construct containing the first 4 ZFs, we observed that ZFs 3 and 4 form an unusual compact and stable structure that restricts their motions. Disruption of this compact structure by an electrostatically mismatched A86K mutation profoundly affected the DNA binding properties of the WT construct. On the one hand, Miz1-4WT was found to bind the Miz-1 DNA consensus sequence weakly and through ZFs 1-3 only. On the other hand, the four ZFs in the structurally destabilized Miz1-4A86K mutant bound to the DNA consensus with a 30-fold increase in affinity (100 nm). The formation of such a thermodynamically stable but nonspecific complex is expected to slow down the rate of DNA scanning by Miz-1 during the search for its consensus sequence. Interestingly, we found that the motif stabilizing the compact structure between ZFs 3 and 4 is conserved and enriched in other long poly-ZF proteins. As discussed in detail, our findings support a general role of compact inter-ZF structures in minimizing the formation of off-target DNA complexes.

Keywords: fluorescence anisotropy; nuclear magnetic resonance (NMR); protein dynamic; protein-DNA interaction; protein-protein interaction; structural biology; transcription factor; zinc finger.


Conflict of interest statement

The authors declare that they have no conflicts of interest with the contents of this article

Figures

FIGURE 1.
FIGURE 1.
Folding and secondary structure content of Miz1–4. A, alignment of the primary structures of the 13 ZFs of Miz-1. B, far-UV CD spectra of Miz1–4 at different pH and Zn(II) concentrations, demonstrating that the secondary structure content is optimal at pH 6.5 and 4 eq of Zn(II). C, 1H-15N HSQC of Miz1–4. Many resonances of ZF 1 (residues 4–26) are weak or broadened beyond detection. D, the expected secondary structures for the consensus ZF motifs and the secondary structures determined from the chemical shifts of the backbone atoms and the program DANGLE are shown at the top. Secondary chemical shift values for the Cα and Cβ (Δδ (Cα − Cβ)) along with NOE connectivities are displayed and support the presence of the expected secondary structures for Miz1–4 ZFs.
FIGURE 2.
FIGURE 2.
Conformational exchange of Miz1–4 probed by 15N relaxation dispersion experiments. A, representative CPMG dispersion curves are shown for some residues of the first ZF 1. The R2,eff values for Lys20, Ile23, Ile25, and His29 decrease as a function of the νCPMG, demonstrating the presence of microsecond to millisecond motions in contrast to Glu29, which shows no dispersion. B, Miz1–4 residues having an Rex contribution are colored in orange, and residues invisible on the 1H-15N HSQC spectrum are shown in red. Error bars, S.D.
FIGURE 3.
FIGURE 3.
Stacked bar chart of the NOE used for the calculation of the Miz1–4 structure. Intraresidue, sequential, medium range, and long range NOE are colored in light gray, gray, dark gray, and black, respectively. Note the many long range NOEs involve residues from the linker between ZFs 3 and 4 (linkers are highlighted in light gray).
FIGURE 4.
FIGURE 4.
Solution structures of Miz-1 ZF 2 and ZF 3–4. A, the 20 lowest energy conformers of individual ZFs aligned onto the geometric average structure backbone atoms. B, schematic representations of the lowest energy structures. Residues potentially involved in DNA binding at positions −1, 2, 3, and 6, relative to the beginning of the α-helix, are shown in magenta. Residues involved in Zn(II) coordination are in green, and conserved hydrophobic residues are shown in blue. Zn(II) atoms are displayed as gray balls. C, the 20 lowest energy conformers of ZFs 3 and 4 aligned onto the geometric average structure are shown to the left. A schematic representation of the lowest energy structure is shown to the right. Key residues at the ZF 3–4 interface that stabilize the compact structure are shown as green spheres. Residues normally involved in DNA binding based on classical DNA recognition are shown as magenta sticks. D, attribution of some resonances of Ala86 and Leu96 side chains are shown on the aliphatic region of the 1H-13C HSQC at the top. At the bottom, a strip of the 13C-edited NOESY-HSQC on the Ala Cβ plane (18.5 ppm) shows some NOEs observed between the Ala Hβ and many Leu96 side chain protons that dictate the compact structure of Miz-1 ZF 3–4.
FIGURE 5.
FIGURE 5.
Backbone 15N spin relaxation measurements for Miz1–4. Bar plots of {1H}-15N NOE, T1, T2, and T1/T2 values are shown as a function of the Miz1–4 primary structure. Secondary structures expected for the consensus ZF fold are shown at the top and are highlighted in gray on the plots. Error bars, S.D.
FIGURE 6.
FIGURE 6.
15N spin relaxation indicates that Miz1–4 ZFs undergo axially symmetric rotational diffusion in solution and confirms the compact fold of ZFs 3–4. Shown are orientations of ZF 2 (A) and ZF 3 (B) in the axially symmetric diffusional reference frame. Dpar is the rotational diffusion constant parallel to the unique axis (along z) of the diffusion tensor. Dper rotational diffusion constants are perpendicular to the unique axis and aligned along x and y. Both Dper values are equal and smaller than Dpar. The amide bonds used for all analyses are shown as spheres. Experimental (black) and simulated values (red) of the amide bonds used for analysis are shown as a function of the position in the primary structure (C and D), and their α-angle values (E and F) for ZFs 2 and 3, respectively. α-Angles are the angles between the direction of the bond vectors and Dpar. G, ZF 3–4 compact structure aligned in the axially symmetric diffusion tensor (ZF 3 is shown in the same diffusional and molecular frame as in B). Shown are experimental (black) and simulated values (red for completely rigid amides and green for amides with a τe = 1.7 ns and an S2 = 0.75 for ZF 4 amides) as a function of their position in the primary structure (H) and their α-angle values (I). ZF 4 T1/T2 values are best described considering internal motions (τe = 1.7 ns, S2 = 0.75) suggesting a collective wobbling motion of ZF 4 relative to ZF 3. J, the 20 conformers of the final ensemble of ZF 3–4 are aligned for ZF 3 backbone atoms, illustrating the wobbling motions of the ZF 4. The average structure is in magenta. A cone with a semiangle θ of 25°, illustrating the ZF 4 domain motion amplitude considering a S2 of 0.75, is shown. Error bars, S.D.
FIGURE 7.
FIGURE 7.
The mutation Ala86 → Lys destabilizes the compact structure adopted by Miz-1 ZFs 3 and 4. A, overlay of Miz1–4 and Miz1–4A86K 1H-15N HSQC spectra. B, the chemical shift displacements (CSD; Δδ = ((δHN)2 + (δN/6.5)2)½) are displayed as a function of the Miz1–4 primary structure. The residues presenting CSD greater than the average + 0.5 of the S.D. values (i.e. 0.06 ppm) are labeled with asterisks, and their amides are shown as spheres on the Miz-1 ZF 3–4 structure in C. The amide at position 86 is labeled in magenta. Red dashed lines represent examples of some NOEs diagnostic of the compact structure involving the Arg87 HN that were lost upon A86K mutation. D, 15N-T1/T2 values of Miz1–4A86K are shown as black bars, whereas the values recorded for the wild type are shown as red dots. E, orientations of ZFs 2, 3, and 4 of Miz1–4A86K in the axially symmetric diffusional reference frame. Error bars, S.D.
FIGURE 8.
FIGURE 8.
Miz1–4 is not involved in the recognition of Miz-1 DNA cognate sequences. A, ZF 4 is aligned with the ZF 2 of Zif268 bound to its DNA target in a classical fashion (PDB code 1AAY). Due to the compact structure, ZFs 1–3 are projected away from DNA, demonstrating that the fold adopted by ZF 3–4 is unlikely for classical DNA binding by these motifs. The DNA backbone is depicted as a magenta ribbon. B, binding curves obtained from fluorescence anisotropy experiments following the addition of Miz1–4 to the fluorescein-dT-labeled DNA. The apparent Kd values were determined as described under “Experimental Procedures” and resulted from two biological replicates and three technical replicates. The binding curve of Miz1–4A86K to the consensus DNA is shown as a dashed line. C, close-up of the 1H-15N HSQC spectra of Miz1–4 before and after the addition of 1 molar eq of the Miz-1 consensus DNA. The amide cross-peaks of the ZFs 1–3 (residues 4–82) disappear upon the addition of DNA, whereas most of the ZF 4 (residues 88–110, boldface labels) cross-peaks are still visible and at similar chemical shifts. The four potential binding site of Miz1–4 (considering ZF 1–3 binding) are depicted. The residues at positions −1, 3, and 6 of the Miz1–4 ZF recognition helices are shown, and predicted contacts are in boldface type in the consensus sequence. Arg residues at position 6 of the ZFs 1 and 6 are displayed in green to emphasize the fact that an Arg at that position generally strongly and specifically binds a guanine. As depicted on the model shown at the right, the ZFs 1–3 of Miz1–4 are most likely simultaneously bound to the different sites, whereas the compact structure adopted by ZF 3–4 prevents the binding of the ZF 4. D, close-up of the 1H-15N HSQC spectra of Miz1–4A86K before and after the addition of 1 molar eq of the Miz-1 consensus DNA. The amide cross-peaks of the ZFs 1–4 (residues 4–110) shift upon the addition of DNA. The two potential binding sites that would allow the Arg at position 6 of ZFs 1 and 4 to contact a guanine are displayed. The mutation destabilizes the compact structure adopted by ZFs 3 and 4, allowing the four ZFs to contact the consensus DNA and form a well defined specific complex. Error bars, S.D.
FIGURE 9.
FIGURE 9.
Model of Miz-1 recognition of its DNA consensus sequence. A, summary of the dynamic and structural properties of Miz-1 ZFs and their impact on DNA binding. B, the consensus DNA of Miz-1, identified by Wolf et al. (8), is depicted, and the three conserved regions of the consensus are displayed in boldface letters. Residues at positions −1, 3, and 6 of the 12 consecutive Miz-1 ZF recognition helices are shown. Predicted contacts with the consensus are labeled with asterisks. Boldface asterisks identify strong interactions (i.e. Arg and Lys with a G or Asp with a C). ZFs 1–6 are colored in red, and ZFs 7–12 are shown in green. C, sequence logo predicted to be bound by Miz-1 ZFs 7–12 (reverse complement), according to the statistical approach developed by Persikov et al. (21). Note the striking similarity with the consensus sequence. DNA bases predicted to be specifically bound are labeled with asterisks. D, model depicting the recognition mode of Miz-1 ZFs for the binding of the first conserved DNA region of the consensus sequence.

Similar articles

Cited by

References

    1. Peukert K., Staller P., Schneider A., Carmichael G., Hänel F., and Eilers M. (1997) An alternative pathway for gene regulation by Myc. EMBO J. 16, 5672–5686 - PMC - PubMed
    1. Seoane J., Le H. V., and Massagué J. (2002) Myc suppression of the p21(Cip1) Cdk inhibitor influences the outcome of the p53 response to DNA damage. Nature 419, 729–734 - PubMed
    1. Staller P., Peukert K., Kiermaier A., Seoane J., Lukas J., Karsunky H., Möröy T., Bartek J., Massague J., Hänel F., and Eilers M. (2001) Repression of p15INK4b expression by Myc through association with Miz-1. Nat. Cell Biol. 3, 392–399 - PubMed
    1. Adhikary S., Peukert K., Karsunky H., Beuger V., Lutz W., Elsässer H. P., Möröy T., and Eilers M. (2003) Miz1 is required for early embryonic development during gastrulation. Mol. Cell. Biol. 23, 7648–7657 - PMC - PubMed
    1. van Riggelen J., Müller J., Otto T., Beuger V., Yetil A., Choi P. S., Kosan C., Möröy T., Felsher D. W., and Eilers M. (2010) The interaction between Myc and Miz1 is required to antagonize TGFβ-dependent autocrine signaling during lymphoma formation and maintenance. Genes Dev. 24, 1281–1294 - PMC - PubMed

Publication types

LinkOut - more resources