. 2016 Oct 21;10(1):68-76.
doi: 10.1111/eva.12417. eCollection 2017 Jan.

Evolution-informed modeling improves outcome prediction for cancers

Affiliations

Evolution-informed modeling improves outcome prediction for cancers

Li Liu et al. Evol Appl. .

Abstract

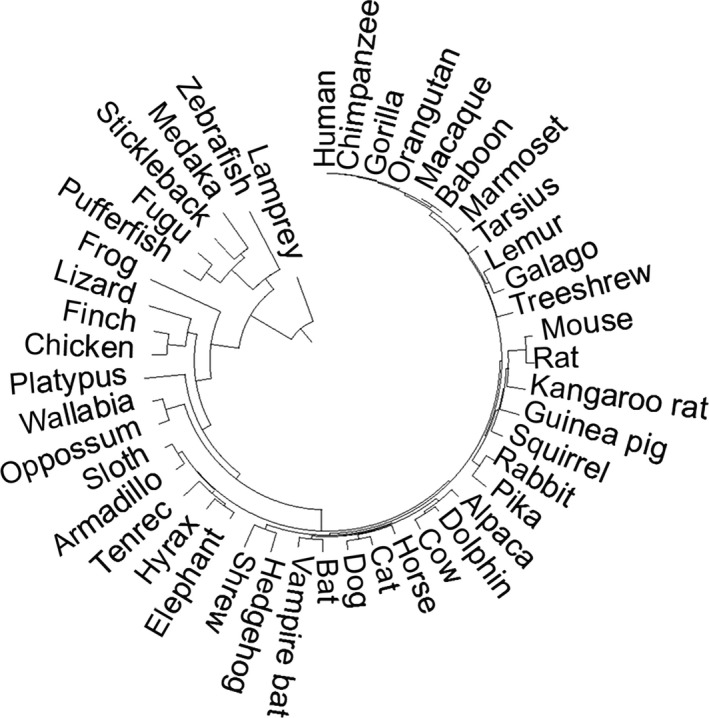
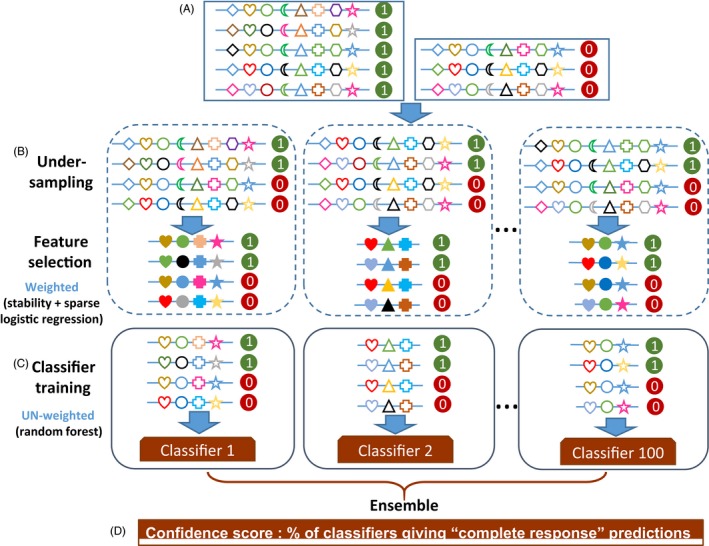
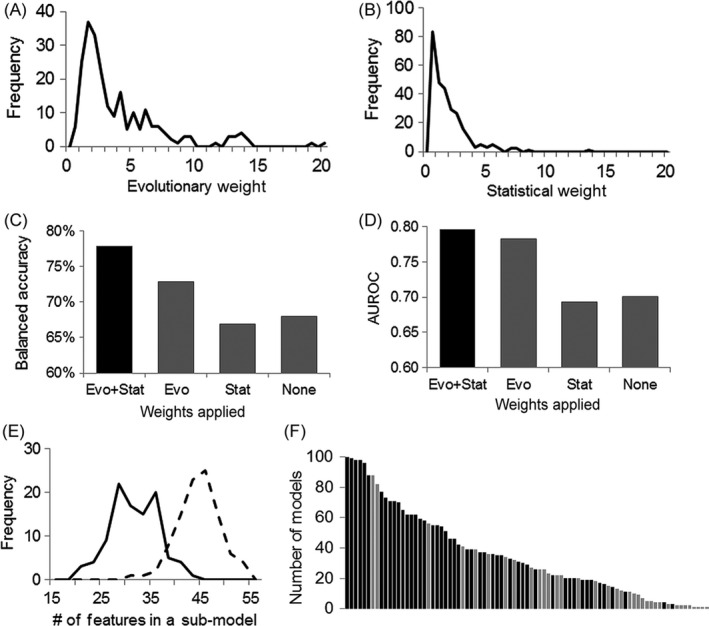
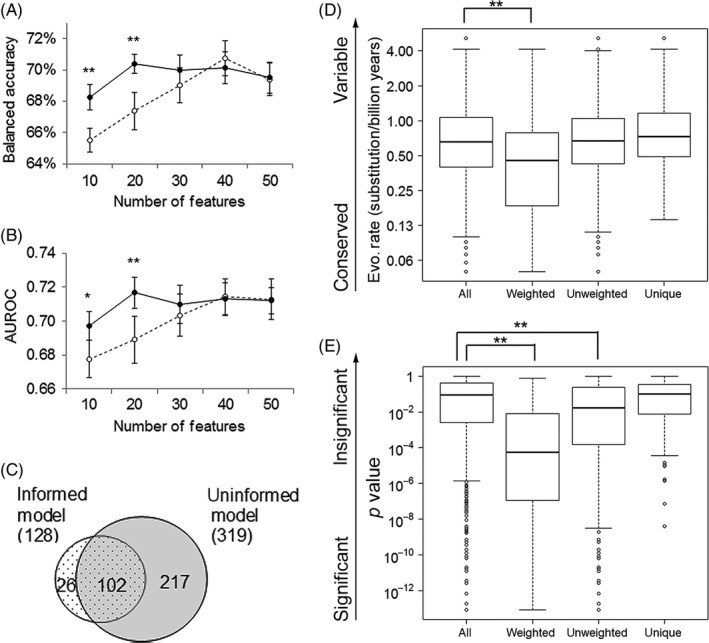
Despite wide applications of high-throughput biotechnologies in cancer research, many biomarkers discovered by exploring large-scale omics data do not provide satisfactory performance when used to predict cancer treatment outcomes. This problem is partly due to the overlooking of functional implications of molecular markers. Here, we present a novel computational method that uses evolutionary conservation as prior knowledge to discover bona fide biomarkers. Evolutionary selection at the molecular level is nature's test on functional consequences of genetic elements. By prioritizing genes that show significant statistical association and high functional impact, our new method reduces the chances of including spurious markers in the predictive model. When applied to predicting therapeutic responses for patients with acute myeloid leukemia and to predicting metastasis for patients with prostate cancers, the new method gave rise to evolution-informed models that enjoyed low complexity and high accuracy. The identified genetic markers also have significant implications in tumor progression and embrace potential drug targets. Because evolutionary conservation can be estimated as a gene-specific, position-specific, or allele-specific parameter on the nucleotide level and on the protein level, this new method can be extended to apply to miscellaneous "omics" data to accelerate biomarker discoveries.

Keywords: evolutionary medicine; genomics/proteomics; molecular evolution; transcriptomics.


Figures

Figure 1
Figure 1
TimeTree of the 46 species used in computing evolutionary parameters. Branch length is proportional to species divergence times obtained from the TimeTree database (Hedges et al., 2006)
Figure 2
Figure 2
Graphical representation of the workflow of evolution‐informed modeling. (A) Input matrix. Each row represents a sample, with positive samples (i.e., with poor clinical outcomes) labeled as “1” and negative samples (i.e., with good clinical outcomes) labeled as “0.” Each column represents a feature, as indicated by different symbols. (B) Feature selection. Subsets of the input data are generated using under‐sampling that randomly chooses equal numbers of positive and negative samples. For each subset, feature values are transformed with composite weights. Feature selection is then applied on the weighted features. Using stability selection and sparse logistic regression, informative features are selected. Open symbols represent un‐weighted features. Solid symbols represent weighted features. (C) Classification model. For each subset, un‐weighted values of selected features are used to build a random forest classifier (a submodel). Collectively, these submodels comprise the ensemble model. (D) Prediction. For an unknown sample, each submodel produces a predicted label. The majority rule is used for the final prediction. The percentage of submodels that predict the sample as the positive class label is used as the confidence score of the final prediction
Figure 3
Figure 3
Evolution‐informed modeling to predict treatment outcomes for AML patients. Distributions of evolutionary weights (A) and statistical weights (B). Balanced accuracy (C) and AUROC (D) value of models that uses composite weight, only evolutionary weight, only statistical weight and no weight. (E) Distribution of the number of features in each submodel when composite weight (solid line) or no weight is used (broken line). Number of features is an indicator of the complexity of a model. (F) Number of submodels in which a clinical feature (black bars) or a proteomic feature (gray bars) is included. Plot consists of 85 features that were included in at least one submodel when composite weight is used
Figure 4
Figure 4
Evolution‐informed modeling to predict metastasis for prostate cancers. Balanced accuracy (A) and AUROC values (B) for evolution‐informed models (solid lines) and for un‐weighted models (broken lines) that include various numbers of features. Average values with standard errors are plotted. * and ** indicate significant difference with t test p value <.05 or <.01, respectively. (C) Venn diagram of proteins included in the top‐performing evolution‐informed model and in the top‐performing uninformed model. Box plots to compare the distributions of evolutionary rate (D) and statistical significance (E) between all proteins, proteins included in the top‐performing evolution‐informed model, proteins included in the top‐performing uninformed models, and proteins unique to the top‐performing uninformed model. ** indicates significant difference with t test p value <.01

References

    1. Ballard‐Barbash, R. , Friedenreich, C. M. , Courneya, K. S. , Siddiqi, S. M. , McTiernan, A. , & Alfano, C. M. (2012). Physical activity, biomarkers, and disease outcomes in cancer survivors: A systematic review. Journal of the National Cancer Institute, 104, 815–840. - PMC - PubMed
    1. Banerji, V. , Frumm, S. M. , Ross, K. N. , Li, L. S. , Schinzel, A. C. , Hahn, C. K. , … Stegmaier, K . (2012). The intersection of genetic and chemical genomic screens identifies GSK‐3alpha as a target in human acute myeloid leukemia. The Journal of Clinical Investigation, 122, 935–947. - PMC - PubMed
    1. Berger, B. , Peng, J. , & Singh, M. (2013). Computational solutions for omics data. Nature Reviews Genetics, 14, 333–346. - PMC - PubMed
    1. Brooks, J. D. (2012). Translational genomics: The challenge of developing cancer biomarkers. Genome Research, 22, 183–187. - PMC - PubMed
    1. Burrell, R. A. , & Swanton, C. (2014). Tumour heterogeneity and the evolution of polyclonal drug resistance. Molecular Oncology, 8, 1095–1111. - PMC - PubMed