

Current and future ozone risks to global terrestrial biodiversity and ecosystem processes
- PMID: 28035269
- PMCID: PMC5192800
- DOI: 10.1002/ece3.2568
Current and future ozone risks to global terrestrial biodiversity and ecosystem processes
Abstract
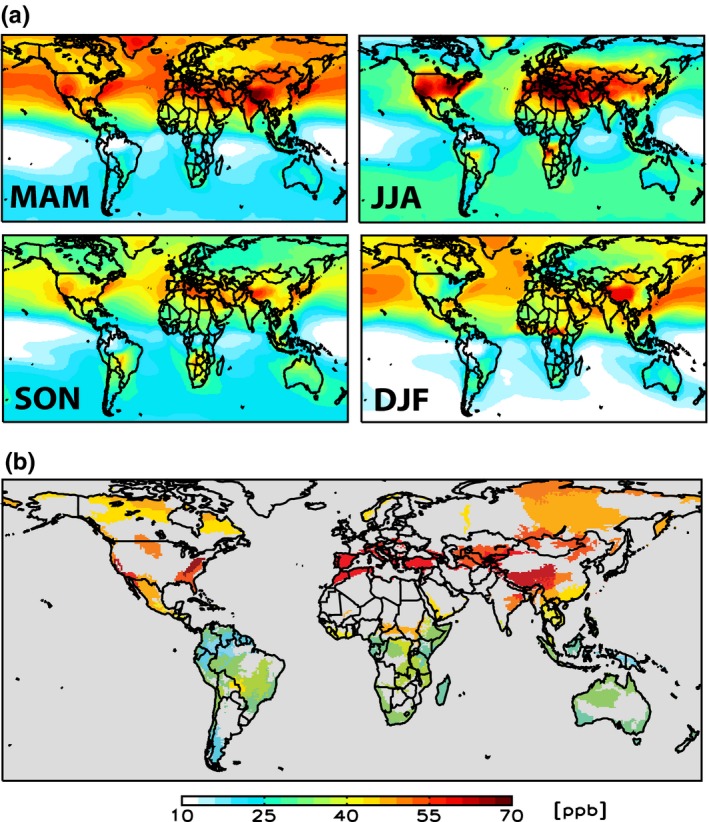
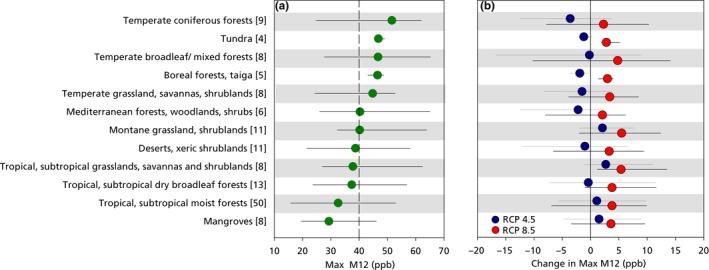
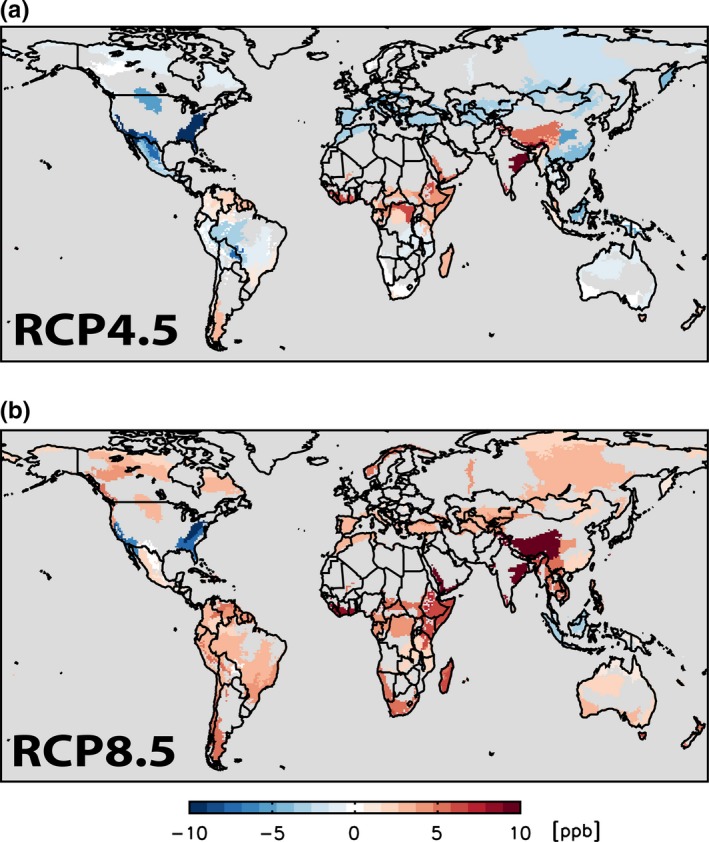
Risks associated with exposure of individual plant species to ozone (O3) are well documented, but implications for terrestrial biodiversity and ecosystem processes have received insufficient attention. This is an important gap because feedbacks to the atmosphere may change as future O3 levels increase or decrease, depending on air quality and climate policies. Global simulation of O3 using the Community Earth System Model (CESM) revealed that in 2000, about 40% of the Global 200 terrestrial ecoregions (ER) were exposed to O3 above thresholds for ecological risks, with highest exposures in North America and Southern Europe, where there is field evidence of adverse effects of O3, and in central Asia. Experimental studies show that O3 can adversely affect the growth and flowering of plants and alter species composition and richness, although some communities can be resilient. Additional effects include changes in water flux regulation, pollination efficiency, and plant pathogen development. Recent research is unraveling a range of effects belowground, including changes in soil invertebrates, plant litter quantity and quality, decomposition, and nutrient cycling and carbon pools. Changes are likely slow and may take decades to become detectable. CESM simulations for 2050 show that O3 exposure under emission scenario RCP8.5 increases in all major biomes and that policies represented in scenario RCP4.5 do not lead to a general reduction in O3 risks; rather, 50% of ERs still show an increase in exposure. Although a conceptual model is lacking to extrapolate documented effects to ERs with limited or no local information, and there is uncertainty about interactions with nitrogen input and climate change, the analysis suggests that in many ERs, O3 risks will persist for biodiversity at different trophic levels, and for a range of ecosystem processes and feedbacks, which deserves more attention when assessing ecological implications of future atmospheric pollution and climate change.
Keywords: Community Earth System Model; G200 ecoregions; air pollution; atmospheric feedback; global climate change; species diversity.
Figures
References
-
- Agrell, J. , Kopper, B. , McDonald, E. P. , & Lindroth, R. L. (2005). CO2 and O3 effects on host plant preferences of the forest tent caterpillar (Malacosoma disstria). Global Change Biology, 11, 588–599.
-
- Anav, A. , De Marco, A. , Proietti, C. , Alessandri, A. , Dell'Aquila, A. , Cionni, I. , … Vitale, M. (2016). Comparing concentration‐based (AOT40) and stomatal uptake (PODY) metrics for ozone risk assessment to European forests. Global Change Biology, 22, 1608–1627. - PubMed
-
- Andersen, C. P. (2003). Source‐sink balance and carbon allocation below ground in plants exposed to O3 . New Phytologist, 157, 213–228. - PubMed
-
- Aneja, M. K. , Sharma, S. , Fleischmann, F. , Stich, S. , Heller, W. , Bahnweg, G. , … Schloter, M. (2007). Influence of ozone on litter quality and its subsequent effects on the initial structure of colonizing microbial communities. Microbial Ecology, 54, 151–160. - PubMed
-
- Arbaugh, M. J. , & Bytnerowicz, A. (2003). Ambient ozone patterns and effects over the Sierra Nevada: Synthesis and implications for future research. Developments in Environmental Science, 2, 249–261.
Publication types
LinkOut - more resources
Full Text Sources
Other Literature Sources
Miscellaneous
