. 2017 May;29(5):10.1111/nmo.13010.
doi: 10.1111/nmo.13010. Epub 2016 Dec 29.

High-resolution electrical mapping of porcine gastric slow-wave propagation from the mucosal surface

Affiliations

High-resolution electrical mapping of porcine gastric slow-wave propagation from the mucosal surface

T R Angeli et al. Neurogastroenterol Motil. 2017 May.

Abstract

Background: Gastric motility is coordinated by bioelectrical slow waves, and gastric dysrhythmias are reported in motility disorders. High-resolution (HR) mapping has advanced the accurate assessment of gastric dysrhythmias, offering promise as a diagnostic technique. However, HR mapping has been restricted to invasive surgical serosal access. This study investigates the feasibility of HR mapping from the gastric mucosal surface.

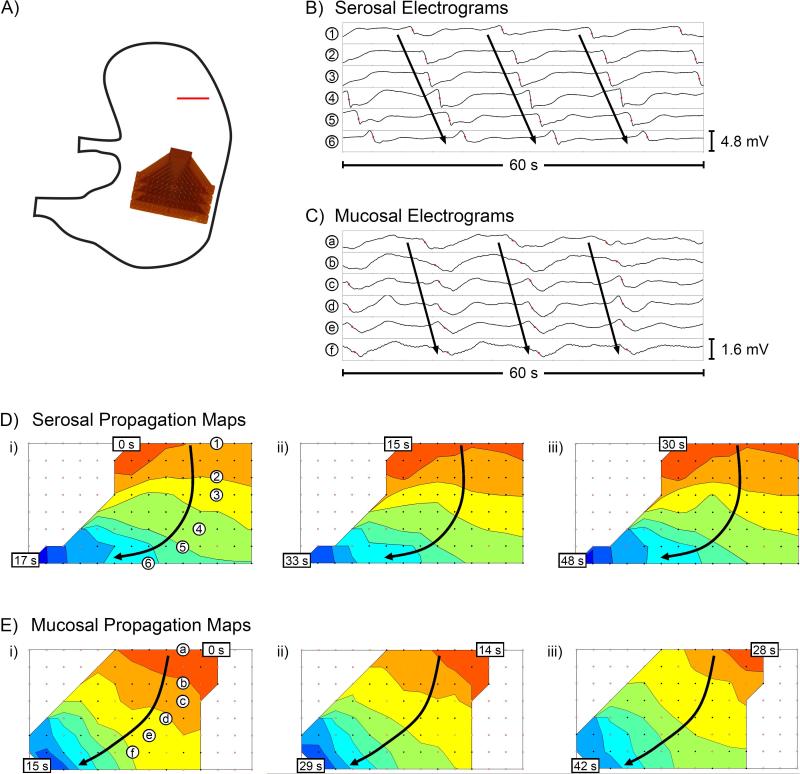
Methods: Experiments were conducted in vivo in 14 weaner pigs. Reference serosal recordings were performed with flexible-printed-circuit (FPC) arrays (128-192 electrodes). Mucosal recordings were performed by two methods: (i) FPC array aligned directly opposite the serosal array, and (ii) cardiac mapping catheter modified for gastric mucosal recordings. Slow-wave propagation and morphology characteristics were quantified and compared between simultaneous serosal and mucosal recordings.

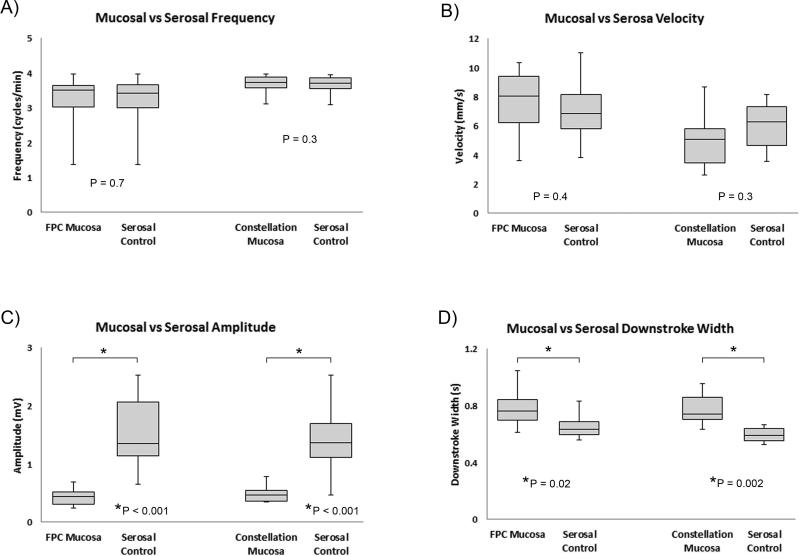
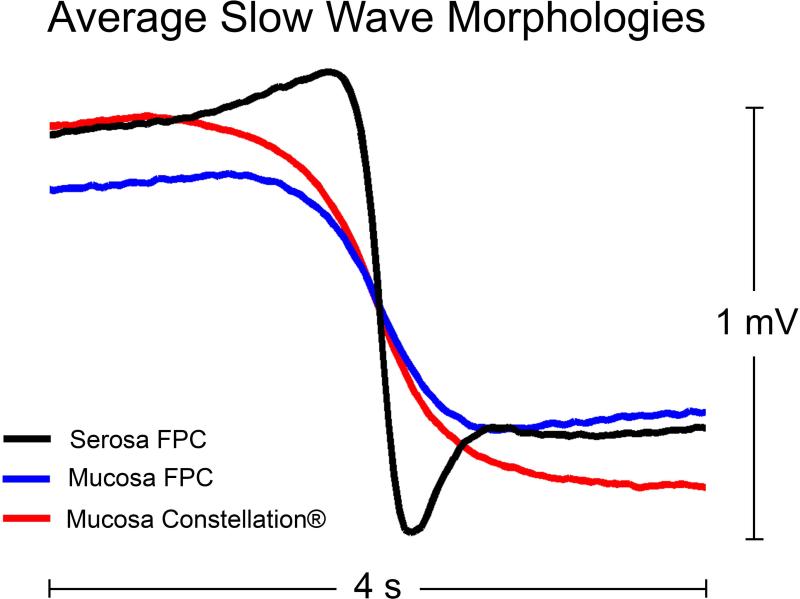
Key results: Slow-wave activity was consistently recorded from the mucosal surface from both electrode arrays. Mucosally recorded slow-wave propagation was consistent with reference serosal activation pattern, frequency (P≥.3), and velocity (P≥.4). However, mucosally recorded slow-wave morphology exhibited reduced amplitude (65-72% reduced, P<.001) and wider downstroke width (18-31% wider, P≤.02), compared to serosal data. Dysrhythmias were successfully mapped and classified from the mucosal surface, accorded with serosal data, and were consistent with known dysrhythmic mechanisms in the porcine model.

Conclusions & inferences: High-resolution gastric electrical mapping was achieved from the mucosal surface, and demonstrated consistent propagation characteristics with serosal data. However, mucosal signal morphology was attenuated, demonstrating necessity for optimized electrode designs and analytical algorithms. This study demonstrates feasibility of endoscopic HR mapping, providing a foundation for advancement of minimally invasive spatiotemporal gastric mapping as a clinical and scientific tool.

Keywords: dysmotility; electrophysiology; endoscopy; motility; stomach.


Figures

Figure 1
Figure 1
Electrode arrays. A) FPC electrode array encompassing 128 total electrodes, arranged in a 16 x 8 array, with 4 mm inter-electrode spacing. This FPC array was used for all serosal reference recordings in this study, and a second identical array was used for FPC mucosal recordings. B) Modified Constellation™ electrode array for mucosal mapping encompassing 64 total electrodes arranged in a flexible ‘basket’ (75 mm diameter) of 8 vertical strands. Each strand encompassed 8 electrodes with 7 mm inter-electrode spacing. An internal balloon was built into the middle of the basket, enabling deflation of the device (i) for induction into the stomach, and inflation of the device (ii) to achieve and maintain electrode contact with the mucosal surface during recording periods.
Figure 2
Figure 2
Comparison of normal antegrade slow-wave propagation simultaneously mapped from the serosal and mucosal surfaces using FPC electrode arrays. A) FPC electrode arrays were placed in direct opposition on the mucosa and serosa of the mid-corpus; red line indicates position of incision through gastric wall. B,C) Electrograms from the serosa (B) vs mucosa (C) from corresponding electrode positions as labeled in panels Di and Ei, respectively. D,E) Isochronal activation maps of slow-wave propagation from the serosa (D) vs mucosa (E), across successive waves (i-iii). Slow-wave propagation was consistent between mucosal and serosal recordings. Black dots represent electrodes, with white dots outlined in red representing electrodes where activity was interpolated. Each color band (‘isochrone’) shows the area of slow-wave propagation per 2 s, from red (early) to blue (late).
Figure 3
Figure 3
Comparison of normal antegrade slow-wave propagation simultaneously mapped from the serosa with FPC electrodes and mucosa with a modified Constellation™ electrode array. A) Position of serosal FPC electrode array (i, red line indicates position of incision through gastric wall) and electrograms (ii) from corresponding electrode positions labeled in panel Ci. B) Position of mucosal modified Constellation™ electrode array (i) and electrograms (ii) from corresponding electrode positions labeled in panel Di. C,D) . Isochronal activation maps of slow-wave propagation recorded simultaneously from the serosal FPC electrodes (C) vs mucosal modified Constellation™ (D), across successive waves (i-iii). Slow-wave propagation was consistent between mucosal and serosal recordings. Activation maps are as described in Figure 2, with 1 s isochrones.
Figure 4
Figure 4
Comparison of dysrhythmic slow-wave propagation simultaneously mapped from the serosal and mucosal surfaces using FPC electrode arrays. A) FPC electrode arrays were placed in direct opposition on the mucosa and serosa of the corpus; red line indicates position of incision through gastric wall. B,C) Electrograms from the serosa (B) vs mucosa (C) from corresponding electrode positions as labeled in panels Di and Ei, respectively. D,E) Isochronal activation maps of slow-wave propagation from the serosa (D) vs mucosa (E), across successive waves (i-iii). Slow-wave propagation was consistent between mucosal and serosal recordings. Shown here are two cycles of dysrhythmic slow-wave propagation encompassing retrograde propagation and wavelet rotation around a functional conduction block represented by a thick black line (i, ii), followed by a cycle of antegrade propagation (iii). Activation maps are as described in Figure 2, with 1 s isochrones.
Figure 5
Figure 5
Comparison of quantitative slow-wave characteristics between serosal vs mucosal recordings, including: A) Frequency; B) Velocity; C) Amplitude; and D) Downstroke width.
Figure 6
Figure 6
Average slow-wave morphologies from the reference serosal FPC electrode arrays versus mucosal FPC and modified Constellation™ electrode arrays, demonstrating the decreased amplitude and wider downstroke achieved from the mucosal surface.

References

    1. Huizinga JD, Lammers WJEP. ut peristalsis is governed by a multitude of cooperating mechanisms. Am J Physiol Gastrointest Liver Physiol. 2009;296:G1–8. - PubMed
    1. Angeli TR, Cheng LK, Du P, Wang TH-H, Bernard CE, Vannucchi M-G, et al. Loss of interstitial cells of Cajal and patterns of gastric dysrhythmia in patients with chronic unexplained nausea and vomiting. Gastroenterology. 2015;149(1):56–66. e5. - PMC - PubMed
    1. O'Grady G, Angeli TR, Du P, Lahr C, Lammers WJEP, Windsor JA, et al. Abnormal initiation and conduction of slow-wave activity in gastroparesis, defined by high-resolution electrical mapping. Gastroenterology. 2012;143(3):589–98. e1–3. - PMC - PubMed
    1. Grover M, Farrugia G, Lurken MS, Bernard CE, Faussone-Pellegrini MS, Smyrk TC, et al. Cellular changes in diabetic and idiopathic gastroparesis. Gastroenterology. 2011;140(5):1575–85. e8. - PMC - PubMed
    1. Lin X, Chen JZ. Abnormal gastric slow waves in patients with functional dyspepsia assessed by multichannel electrogastrography. Am J Physiol Gastrointest Liver Physiol. 2001;280(6):G1370–5. - PubMed

Publication types

LinkOut - more resources