. 2016 Dec 30:5:e23156.
doi: 10.7554/eLife.23156.

Measuring the sequence-affinity landscape of antibodies with massively parallel titration curves

Affiliations

Measuring the sequence-affinity landscape of antibodies with massively parallel titration curves

Rhys M Adams et al. Elife. .

Abstract

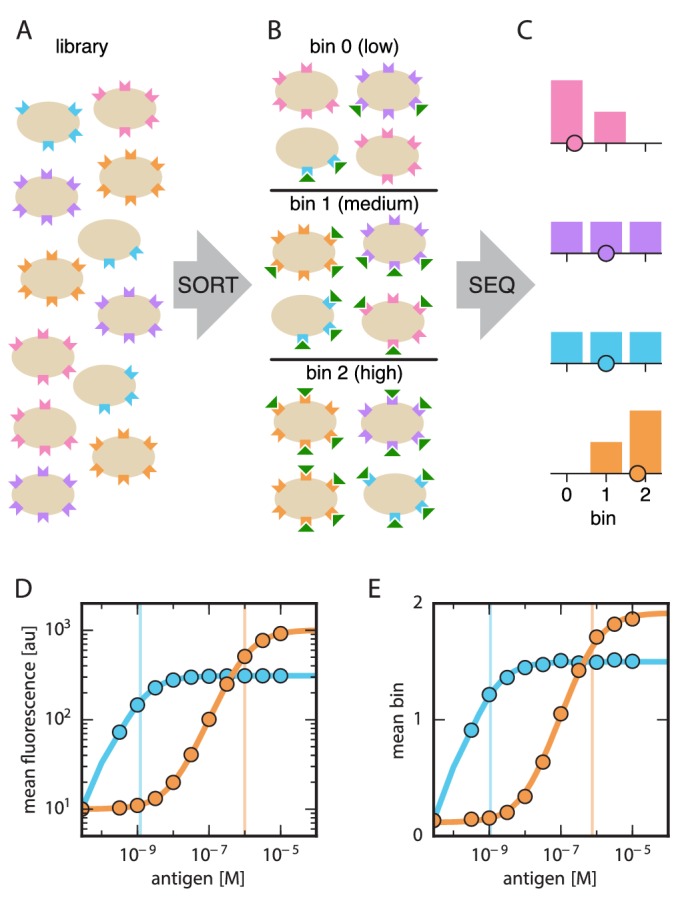
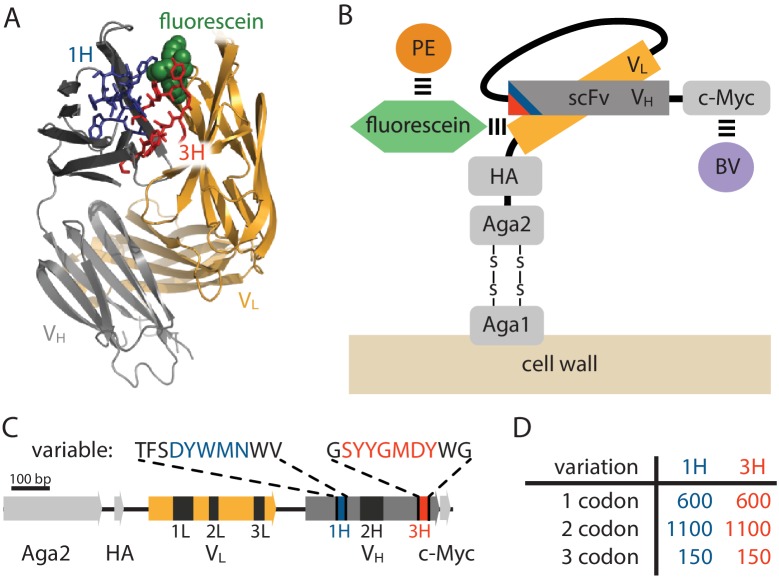
Despite the central role that antibodies play in the adaptive immune system and in biotechnology, much remains unknown about the quantitative relationship between an antibody's amino acid sequence and its antigen binding affinity. Here we describe a new experimental approach, called Tite-Seq, that is capable of measuring binding titration curves and corresponding affinities for thousands of variant antibodies in parallel. The measurement of titration curves eliminates the confounding effects of antibody expression and stability that arise in standard deep mutational scanning assays. We demonstrate Tite-Seq on the CDR1H and CDR3H regions of a well-studied scFv antibody. Our data shed light on the structural basis for antigen binding affinity and suggests a role for secondary CDR loops in establishing antibody stability. Tite-Seq fills a large gap in the ability to measure critical aspects of the adaptive immune system, and can be readily used for studying sequence-affinity landscapes in other protein systems.

Keywords: S. cerevisiae; affinity; antibody; biophysics; deep mutational scan; dissociation constant; structural biology; titration curve.


Conflict of interest statement

The authors declare that no competing interests exist.

Figures

Figure 1.
Figure 1.. Schematic illustration of Tite-Seq.
(A) A library of variant antibodies (various colors) are displayed on the surface of yeast cells (tan). (B) The library is exposed to antigen (green triangles) at a defined concentration, cell-bound antigen is fluorescently labeled, and FACS is used to sort cells into bins according to measured fluorescence. (C) The antibody variants in each bin are sequenced and the distribution of each variant across bins is computed (histograms; colors correspond to specific variants). The mean bin number (dot) is then used to quantify the typical amount of bound antigen per cell. (D) Binding titration curves (solid lines) and corresponding KD values (vertical lines) can be inferred for individual antibody sequences by using the mean fluorescence values (dots) obtained from flow cytometry experiments performed on clonal populations of antibody-displaying yeast. (E) Tite-Seq consists of performing the Sort-Seq experiment in panels A–C at multiple antigen concentrations, then inferring binding curves using mean bin number as a proxy for mean cellular fluorescence. This enables KD measurements for thousands of variant antibodies in parallel. We note that the Tite-Seq results illustrated in panel E were simulated using three bins under idealized experimental conditions, as described in Appendix 1. The inference of binding curves from real Tite-Seq data is more involved than this panel might suggest, due to the multiple sources of experimental noise that must be accounted for. DOI: http://dx.doi.org/10.7554/eLife.23156.003
Figure 2.
Figure 2.. Yeast display construct and antibody libraries
(A) Co-crystal structure of the 4-4-20 (WT) antibody from Whitlow et al. (1995) (PDB code 1FLR). The CDR1H and CDR3H regions are colored blue and red, respectively. (B) The yeast display scFv construct from Boder and Wittrup (1997) that was used in this study. Antibody-bound antigen (fluorescein) was visualized using PE dye. The amount of surface-expressed protein was separately visualized using BV dye. Approximate location of the CDR1H (blue) and CDR3H (red) regions within the scFv are illustrated. (C) The gene coding for this scFv construct, with the six CDR regions indicated. The WT sequence of the two 10 aa variable regions are also shown. (D) The number of 1-, 2-, and 3-codon variants present in the 1H and 3H scFv libraries. Figure 2—figure supplement 1 shows the cloning vector used to construct the CDR1H and CDR3H libraries, as well as the form of the resulting expression plasmids. DOI: http://dx.doi.org/10.7554/eLife.23156.004
Figure 2—figure supplement 1.
Figure 2—figure supplement 1.. Cloning strategy.
(A) The iRA11 amplicon library, which was prepared from microarray-synthesized oligos containing variant CDR1H or variant CDR3H regions. This amplicon is flanked by inward-facing BsaI restriction sites. (B) The pRA10 cloning vector, which contains the ccdB selection gene within a cassette flanked by outward-facing BsmBI restriction sites. (C) The pRA11 plasmid library, which was cloned by ligating BsaI-digested iRA11 amplicons and BsmBI-digest pRA10 vector. (D) The sequencing amplicon that was amplified from sorted cells after Tite-Seq and Sort-Seq experiments and submitted for ultra-high-throughput DNA sequencing. Appendix 3 provides more details about iRA11 amplicons, the pRA10 vector, and the pRA11 plasmid library. Appendix 4 provides more information about the creation of sequencing amplicons. DOI: http://dx.doi.org/10.7554/eLife.23156.005
Figure 3.
Figure 3.. Details of our Tite-Seq experiments.
(A) Gates used to sort cells based on PE fluorescence, which provides a readout of bound antigen. Cells were labeled at the eleven different antigen concentrations. Shades of red indicate the four fluorescence gates used to sort cells; these correspond to bins 0, 1, 2, and 3 (from left to right). (B) Gates, indicated in shades of purple, used to sort cells based on BV fluorescence, which provides a readout of antibody expression. (C) The number of cells sorted into each bin. (D) The number of Illumina reads obtained from each bin of sorted cells after quality control measures were applied. The data shown in this figure corresponds to a single Tite-Seq experiment. Figure 3—figure supplement 1 and Figure 3—figure supplement 2 show data for two independent replicates of this experiment. DOI: http://dx.doi.org/10.7554/eLife.23156.006
Figure 3—figure supplement 1.
Figure 3—figure supplement 1.. Tite-Seq experiment, replicate 2.
Analog of Figure 3 in the main text, but for the replicate 2 Tite-Seq experiment. DOI: http://dx.doi.org/10.7554/eLife.23156.007
Figure 3—figure supplement 2.
Figure 3—figure supplement 2.. Tite-Seq experiment, replicate 3.
Analog of Figure 3 in the main text, but for the replicate 3 Tite-Seq experiment. DOI: http://dx.doi.org/10.7554/eLife.23156.008
Figure 4.
Figure 4.. Accuracy and precision of Tite-Seq.
(A) Binding curves and KD measurements inferred from Tite-Seq data. (B) Mean fluorescence values (dots) and corresponding inferred binding curves (lines) obtained by flow cytometry measurements for five selected scFvs (WT, OPT, C5, C45, and C107). In (A,B), values corresponding to 0 M fluorescein are plotted on the left-most edge of the plot, dotted lines show the upper (10-5 M) and lower (10-9.5 M) limits on KD sensitivity, vertical lines show inferred KD values, and different shades correspond to different replicate experiments. (C) Comparison of the Tite-Seq-measured and flow-cytometry-measured KD values for all clones tested. Colors indicate different scFv protein sequences as follows: WT (purple), OPT (green), Δ (black), 1H clones (blue), and 3H clones (red). Each KD value indicates the mean log10KD value obtained across all replicates, with error bars indicating standard error. Clones with KD outside of the affinity range are drawn on the boundaries of this range, which are indicated with dotted lines. The coefficient of determination (R2) between log Tite-Seq values and log flow KDvalues includes clones outside of the affinity range; in such cases, the corresponding boundary value (10-9.5 M or 10-5.0 M) has been used. The amino acid sequences and measured KD values for all clones tested are provided in Table 1. Figure 4—figure supplement 1 provides plots, analogous to panels A and B, for all of the assayed clones. Figure 4—figure supplement 2 compares KD and E values obtained across all three Tite-Seq replicates. Figure 4—figure supplement 3 quantifies measurement error using synonymous mutants. Figure 4—figure supplement 4 provides information about library composition. Figure 4—figure supplement 5 illustrates the poor correlation between scFv enrichment and Tite-seq measured KD values. Figure 4—figure supplement 6 shows a 2-fold difference in the specific activities of OPT and WT scFvs. Figure 4—figure supplement 7 illustrates the simulations we used in Figure 4—figure supplement 8 to validate the ability of our analysis to infer correct KD values. DOI: http://dx.doi.org/10.7554/eLife.23156.009
Figure 4—figure supplement 1.
Figure 4—figure supplement 1.. Binding curves for all clones.
Binding curves, measured using (A) Tite-Seq or (B) flow cytometry, for all clones analyzed in this paper and described in Table 1. Plots are drawn as in Figure 4, panels A and B. DOI: http://dx.doi.org/10.7554/eLife.23156.010
Figure 4—figure supplement 2.
Figure 4—figure supplement 2.. Concordance between replicate experiments.
Density plots of (A) Tite-Seq-measured KD values and (B) Sort-Seq-measured E values between all pairs of replicate experiments. Measurements for these quantities that were judged to be of low precision due to low sequence counts are not plotted. f indicates the percentage of total assayed sequences plotted; r is the Pearson correlation and includes clonal measurements outside the boundaries of our measurable ranges (10-9.5-10-5 M for KD, 0–2 for expression). Clones outside of these ranges were given values at the closest boundary. DOI: http://dx.doi.org/10.7554/eLife.23156.011
Figure 4—figure supplement 3.
Figure 4—figure supplement 3.. Error estimates from synonymous mutants.
Density plots for (A) Tite-Seq-measured log10KD standard deviation and average log10KD and (B) Sort-Seq-measured E standard deviation and average E are shown for each scFv sequence with more than one synonymous mutant for each of the replicate experiments. The KD error peaked between 10-7-10-6 M. The expression error peaked at or above WT expression (i.e. 1) levels. DOI: http://dx.doi.org/10.7554/eLife.23156.012
Figure 4—figure supplement 4.
Figure 4—figure supplement 4.. Composition of scFv libraries.
(A) Comparison of library composition between all pairs of replicate experiments. (B) Zipf plots showing the library composition in each replicate experiment. In both panels, the prevalence of each scFv sequence in each replicate experiment was determined as part of the Tite-Seq curve fitting procedure, as described in Appendix 5. DOI: http://dx.doi.org/10.7554/eLife.23156.013
Figure 4—figure supplement 5.
Figure 4—figure supplement 5.. Sort-Seq enrichment correlates poorly with Tite-Seq-measured affinity.
To assess how well simple enrichment calculations might reproduce the KD values measured by Tite-Seq, we did the following calculation. For each of the two libraries (1 H and 3 H), we partitioned scFvs into seven groups based on their measured KDs (columns). For each group at each antigen concentration (rows), we then computed the enrichment of each scFv in the high PE bins (bins 2,3) relative to the low PE bins (bins 0,1). In these enrichment calculations, the number of counts in each bin was re-weighted to accurately reflect the fraction of library cells falling within the fluorescence range of that bin. This figure shows the resulting Spearman rank correlation (ρ) between enrichment and log KD values computed for each scFv group at each antigen concentration. In both libraries, we see that correlation values above background (which can be assessed from the values in the 0 M fluorescein row) only occur close to the diagonal, i.e., when KD is close to the fluorescein concentration used. DOI: http://dx.doi.org/10.7554/eLife.23156.014
Figure 4—figure supplement 6.
Figure 4—figure supplement 6.. Differing specific activities of OPT and WT.
2D flow cytometry histograms showing both OPT- and WT-expressing cells labeled with PE and BV after incubation at 2 μM fluorescein. At this fluorescein concentration, nearly all functional WT and OPT scFvs are bound. Regression lines (fixed to have slope 1) were fit to data points with BV signal between 104.5 and 105. The vertical shift of the OPT data relative to the WT data indicates a factor of 2.03±0.07 difference (computed from four replicate experiments) in the amount labeled antigen. This difference is not due to a difference in the number of surface-displayed scFvs, as this would cause the OPT and WT clouds to lie along the same diagonal. Rather, this difference between WT and OPT is due to variation in specific activity. DOI: http://dx.doi.org/10.7554/eLife.23156.015
Figure 4—figure supplement 7.
Figure 4—figure supplement 7.. Realistic Tite-Seq simulations.
Realistic Tite-Seq data were simulated separately for each distinct pair of affinity (KD) and amplitude (A) values, as described in Appendix 7. This figure shows simulated data, akin to the data displayed in Figure 4—figure supplement 6, for WT values of KD and A. DOI: http://dx.doi.org/10.7554/eLife.23156.016
Figure 4—figure supplement 8.
Figure 4—figure supplement 8.. Validation of analysis pipeline.
KD values were inferred for Tite-Seq data simulated using (green) the same number of cells, (light green) 10-3 times as many cells, or (black) 104 times as many sorted cells as in our experiments. Areas indicate approximately plus or minus one standard deviation in the fitted KD values obtained for each true KD value. DOI: http://dx.doi.org/10.7554/eLife.23156.017
Figure 5.
Figure 5.. Effects of substitution mutations on affinity and expression.
Heatmaps show the measured effects on affinity (A,B) and expression (C,D) of all single amino acid substitutions within the variables regions of the 1H (A,C) and 3H (B,D) libraries. Purple dots indicate residues of the WT scFv. Green dots indicate non-WT residues in the OPT scFv. Figure 5—figure supplement 1 provides histograms of the non-WT values displayed in panels A–D. Figure 5—figure supplement 2 compares the effects on KD of both single-point and multi-point mutations. DOI: http://dx.doi.org/10.7554/eLife.23156.020
Figure 5—figure supplement 1.
Figure 5—figure supplement 1.. Histograms of substitution effects on affinity and expression.
(A,B) Histogram showing the KD values measured for all substitution mutations in the 1 H (A) and 3 H (B) libraries. Note that these are the values plotted in panels A and B of Figure 5, except that the WT KD value is not included. Dashed lines indicate the KD of the WT scFv; dotted lines indicate thresholds just within our detection boundaries, 10-9.49 M and 10-5.01 M, while the colored bars outside this interval indicate the number of substitution mutations with KD above (blue) and below (red) this range. (C,D) Histogram of E values for all single-substitution variants in the 1 H (C) or 3 H (D) libraries. These values, save those of the WT scFv, are plotted in panels C and D of Figure 5. Dashed lines indicate the WT expression level of E=1.0. DOI: http://dx.doi.org/10.7554/eLife.23156.021
Figure 5—figure supplement 2.
Figure 5—figure supplement 2.. Effects of multi-point mutations on affinity and expression.
The effect of 1, 2, or three mutations on (A) Tite-Seq-measured KD values or (B) Sort-Seq-measured E values. Plots show the relative probability density (over 30 bins along the KD or E axes) observed for variants in each class. DOI: http://dx.doi.org/10.7554/eLife.23156.022
Figure 6.
Figure 6.. Structural context of mutational effects.
(A) Crystal structure (Whitlow et al., 1995) of the CDR1H and CDR3H variable regions of the WT scFv in complex with fluorescein (green). Each residue (CDR1H: positions 28–37; CDR3H: positions 100–109) is colored according to the SK and SE values computed for that position. These variables, SK and SE, respectively quantify the sensitivity of KD and E to amino acid substitutions at each position, with larger values corresponding to greater sensitivity; see Equations 2 and 3 for definitions of these quantities. (B,C) For each position in the CDR1H and CDR3H variable regions, SK is plotted against either (B) the number of contacts the WT residue makes within the protein structure, or (C) the distance of the WT residue to the fluorescein molecule. (D,E) Similarly, SE is plotted against either (D) the number of contacts or (E) the distance to the antigen. R2 is the coefficient of determination. DOI: http://dx.doi.org/10.7554/eLife.23156.023

References

    1. Batista FD, Neuberger MS. Affinity dependence of the B cell response to antigen: a threshold, a ceiling, and the importance of off-rate. Immunity. 1998;8:751–759. doi: 10.1016/S1074-7613(00)80580-4. - DOI - PubMed
    1. Boder ET, Midelfort KS, Wittrup KD. Directed evolution of antibody fragments with monovalent femtomolar antigen-binding affinity. PNAS. 2000;97:10701. doi: 10.1073/pnas.170297297. - DOI - PMC - PubMed
    1. Boder ET, Wittrup KD. Yeast surface display for screening combinatorial polypeptide libraries. Nature Biotechnology. 1997;15:553–557. doi: 10.1038/nbt0697-553. - DOI - PubMed
    1. Boyd SD, Marshall EL, Merker JD, Maniar JM, Zhang LN, Sahaf B, Jones CD, Simen BB, Hanczaruk B, Nguyen KD, Nadeau KC, Egholm M, Miklos DB, Zehnder JL, Fire AZ. Measurement and clinical monitoring of human lymphocyte clonality by massively parallel VDJ pyrosequencing. Science Translational Medicine. 2009;1:12ra23. doi: 10.1126/scitranslmed.3000540. - DOI - PMC - PubMed
    1. Burns ML, Malott TM, Metcalf KJ, Hackel BJ, Chan JR, Shusta EV. Directed evolution of brain-derived neurotrophic factor for improved folding and expression in Saccharomyces cerevisiae. Applied and Environmental Microbiology. 2014;80:5732–5742. doi: 10.1128/AEM.01466-14. - DOI - PMC - PubMed

MeSH terms