. 2017;56(2):655-675.
doi: 10.3233/JAD-160823.

Investigations into Retinal Pathology in the Early Stages of a Mouse Model of Alzheimer's Disease

Affiliations
Free PMC article

Investigations into Retinal Pathology in the Early Stages of a Mouse Model of Alzheimer's Disease

Glyn Chidlow et al. J Alzheimers Dis. 2017.
Free PMC article

Abstract

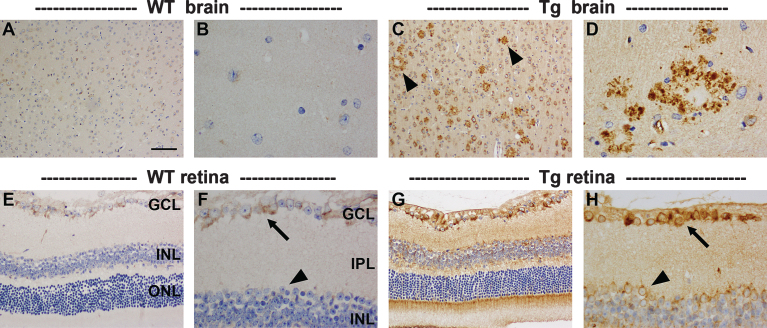
There is increasing recognition that visual performance is impaired in early stages of Alzheimer's disease (AD); however, no consensus exists as to the mechanisms underlying this visual dysfunction, in particular regarding the timing, nature, and extent of retinal versus cortical pathology. If retinal pathology presents sufficiently early, it offers great potential as a source of novel biomarkers for disease diagnosis. The current project utilized an array of immunochemical and molecular tools to perform a characterization of retinal pathology in the early stages of disease progression using a well-validated mouse model of AD (APPSWE/PS1ΔE9). Analytical endpoints included examination of aberrant amyloid and tau in the retina, quantification of any neuronal degeneration, delineation of cellular stress responses of neurons and particularly glial cells, and investigation of oxidative stress. Brain, eyes, and optic nerves were taken from transgenic and wild-type mice of 3 to 12 months of age and processed for immunohistochemistry, qPCR, or western immunoblotting. The results revealed robust expression of the human APP transgene in the retinas of transgenic mice, but a lack of identifiable retinal pathology during the period when amyloid deposits were dramatically escalating in the brain. We were unable to demonstrate the presence of amyloid plaques, dystrophic neurites, neuronal loss, macro- or micro-gliosis, aberrant cell cycle re-entry, oxidative stress, tau hyperphosphorylation, or upregulations of proinflammatory cytokines or stress signaling molecules in the retina. The overall results do not support the hypothesis that detectable retinal pathology occurs concurrently with escalating amyloid deposition in the brains of APPSWE/PS1ΔE9 mice.

Keywords: Alzheimer’s disease; early biomarker; microglia; müller cell; retina; retinal ganglion cell.


Figures

Fig.1
Fig.1
Representative images of Aβ, MOAB-2, Aβ1 - 40, and Aβ1 - 42 immunolabeling in the brain and retina of 12-month-old WT and Tg mice. In Tg parietal cortex (A, B, E, F, I, J, M, N) amyloid plaques are abundant. All four antibodies display high signal-to-noise ratios. In contrast, no amyloid deposits are evident in sections of WT (C, G, K, O) or Tg (D, H, L, P) retinas. Scale bar: A, E, I, M = 250 μm; B-D, F-H, J-L, N-P = 50 μm; GCL, ganglion cell layer; INL, inner nuclear layer; ONL, outer nuclear layer.
Fig.2
Fig.2
Representative images of AβPP immunolabeling in the brain and retina of 11-month-old WT and Tg mice. In WT parietal cortex (A) and hippocampus (B), AβPP localizes to the cytoplasm of neurons. In Tg mice, neuronal expression of AβPP is higher, and numerous dystrophic neurites surrounding amyloid plaques are present within the parietal cortex (C, arrowheads) and hippocampus (D). In the WT retina, AβPP localizes to the cytoplasm of RGCs (arrow), but is barely detectable within amacrine cells (arrowhead) or other neuronal cell types. In Tg mice, AβPP expression is markedly higher in RGCs (arrow), and is also clearly detectable in other neuronal populations (arrowhead); however, no AβPP-positive dystrophic neurites are evident. Scale bar: A, C = 100 μm; E, G = 50 μm, B,D,F,H = 25 μm.
Fig.3
Fig.3
Analysis of retinal thickness and synaptic density in 9–to 12–month-old WT and Tg mice. Representative images of hematoxylin and eosin staining in the central (A, B) and peripheral (C, D) retinas of 11-month-old WT and Tg mice. E) Identification of the retinal layers. F, G) Quantification of the number of rows of cells and the thickness of the outer nuclear layer (ONL). H-J) Quantification of the thicknesses of the inner nuclear layer (INL), inner plexiform layer (IPL), outer plexiform layer (OPL). K-M) Representative images of synaptophysin immunolabeling in the central retinas of 12-month-old WT and Tg mice. Quantification of synaptophysin density in the central and peripheral retina is also shown. In each case, data are expressed as mean±SEM, where n = 10 for each age-matched group. Student’s unpaired t-tests revealed no significant differences. Scale bars: 50 μm.
Fig.4
Fig.4
Analysis of retinal ganglion cells (RGC) in 7–to 12–month-old WT and Tg mice. A-C) Representative images of Brn3a immunolabeling, together with quantification of numbers of Brn3a-labeled RGCs. Brn3a localizes to RGC nuclei (yellow arrow). D-F) Representative images of TUNEL labeling in an NMDA-treated retina (+ve control, see arrows) and 12-month Tg retina, together with quantification of numbers of TUNEL-positive cells in the GCL. G) Levels of RGC-specific (Thy1 and β3-tubulin) mRNAs in Tg retinas as measured by qPCR. Data are normalized for GAPDH and expressed relative to WT. H, I, M, N) Expression of RGC axonal proteins in WT and Tg retinas (H, I), and WT and Tg optic nerves (M, N) as evaluated by western immunoblotting. Single bands of the expected molecular weight are apparent. Data are normalized for actin and expressed relative to WT. J-L) Representative photomicrographs of toluidine blue-stained cross-sections of WT and Tg optic nerves from 12-month-old mice, together with estimated axon counts. Data are expressed relative to WT. For all analyses, data are expressed as mean±SEM, where n = 10 for each age-matched group. Student’s unpaired t-tests revealed no significant differences between WT and Tg cohorts for any of the parameters measured. Scale bar: A, B = 50 μm; D, E = 25 μm, J, K = 10 μm. GCL, ganglion cell layer; INL, inner nuclear layer; β3-tub, β3-tubulin; p-NFH, phosphorylated neurofilament heavy chain.
Fig.5
Fig.5
Analysis of amacrine cells, bipolar cells, horizontal cells, and cone photoreceptors in 7 to 12-month-old Tg retinas. Representative images of calretinin (A, B), PKCα (D, E), calbindin (G, H), and cone arrestin (J, K) immunolabeling are shown. Calretinin is associated with amacrine cell somata (arrow) located in the inner part of the INL, layers of terminals visible in the IPL (arrowhead), and displaced amacrine and ganglion cells in the GCL. PKCα labels bipolar cell somata (arrow) located in the INL and their processes that synapse with photoreceptors and retinal ganglion cells. Calbindin is associated with horizontal cell somata (arrow) located in the outer part of the INL and their dendrites in the outer plexiform layer. Cone arrestin labels cone photoreceptor cell bodies (arrow) located in the ONL, inner and outer cone segments, and synapses in the outer plexiform layer. Quantification of numbers of calbindin-labeled horizontal cells (C), calretinin-labeled amacrine cells (F), PKCα-labeled bipolar cells (I), and cone arrestin-labeled cone photoreceptors (L) are also shown. In each case, data are expressed as mean±SEM, where n = 10 for each age-matched group. Student’s unpaired t-tests revealed no significant differences between the treatment groups at any of the three age groups for any of the four cell types. Scale bars: 50 μm. GCL, ganglion cell layer; INL, inner nuclear layer; ONL, outer nuclear layer.
Fig.6
Fig.6
Analysis of microglia and proinflammatory cytokine levels in WT and Tg mice. Representative images of iba1 immunolabeling in 10-month-old WT and Tg parietal cortex (A, B) and hippocampus (C, D). In Tg brains, reactive microgliosis is evident surrounding amyloid plaques, signified by red asterisks. E, F) Representative images of iba1 immunolabeling in 11-month-old WT and Tg retina. Microglia in both cohorts display ramified morphologies. G, H) Quantitative evaluation of iba1 area and semi-quantitative evaluation of activations status of iba1-positive cells. (I) Levels of IL-1β, TNFα, and IL-6 in Tg retinas as measured by qPCR. Data are normalized for GAPDH and expressed relative to WT. For all analyses, data are expressed as mean±SEM, where n = 10 for each age-matched group. Student’s unpaired t-tests revealed no significant differences between WT and Tg cohorts for any of the parameters measured. Scale bar: A, B = 250 μm; C-F = 25 μm. GCL, ganglion cell layer; INL, inner nuclear layer; ONL, outer nuclear layer.
Fig.7
Fig.7
Analysis of GFAP expression in WT and Tg mice. Representative images of GFAP immunolabeling in 11-month-old WT and Tg parietal cortex (A, B) and hippocampus (C, D). In Tg brains, numerous GFAP-positive astrocytes are evident surrounding amyloid plaques, signified by red asterisks. E-G) Representative images of GFAP labeling in a retina subjected to branch retinal vein occlusion (BRVO, +ve control), and in 12-month-old WT and Tg retinas. GFAP immunoreactivity is chiefly restricted to astrocytes in the retinas of WT and Tg mice. In contrast, four days after BRVO, a substantial upregulation of GFAP is evident both in astrocytes (arrowhead) and Müller cells (arrow). Note: the area of retina shown is adjacent to the vein occlusion site and not directly affected. H) Semi-quantification evaluation of GFAP grade in WT and Tg retinas. Data are expressed as mean±SEM, where n = 10 for each age-matched group. Mann-Whitney test revealed no significant differences between the treatment groups. Scale bar: A, B = 250 μm; C, D = 25 μm; E-G = 50 μm. GCL, ganglion cell layer; INL, inner nuclear layer; ONL, outer nuclear layer. I, J) Expression of GFAP protein in 11–12-month-old WT and Tg retinas as evaluated by western immunoblotting. A single band of the expected molecular weight is apparent. Data (expressed as mean±SEM, where n = 10) are normalized for actin and expressed relative to WT. Student’s unpaired t-test revealed no significant difference between the treatment groups.
Fig.8
Fig.8
Analysis of various cellular stress markers in the retinas of WT and Tg mice. A-C) Expression of nestin in WT and Tg retinas. A) By western immunoblotting, a single band of the expected molecular weight is apparent in an extract from a retinal culture, but no obvious band is apparent in WT or Tg retinas. B) Representative image of nestin labeling in a 12-month-old Tg retina. C) Semi-quantification evaluation of nestin grade in WT and Tg retinas. Data are expressed as mean±SEM, where n = 10 for each age-matched group. Mann-Whitney test revealed no significant differences between the treatment groups. n.d., not determined. D-K) Representative images of cyclin D1 and CNTF labeling in a retina subjected to branch retinal vein occlusion (BRVO, +ve control), and in 12-month-old WT and Tg retinas. D, H) One day after BRVO, astrocytes (arrowhead) and Müller cells (arrow) label strongly for cyclin D1 and CNTF. Note: the area of retina shown is adjacent to the vein occlusion site and not directly affected. E, F) Cyclin D1 immunoreactivity is faintly associated with Müller cells in the retinas of both WT and Tg mice. I, J) CNTF immunoreactivity is faintly associated with Müller cells and astrocytes in the retinas of both WT and Tg mice. G, K) Semi-quantification evaluation of cyclin D1 and CNTF grades in WT and Tg retinas. Data are expressed as mean±SEM, where n = 10 for each age-matched group. Mann-Whitney tests revealed no significant differences between the treatment groups. Scale bar: B = 50 μm; D-F, H-J = 25 μm. GCL, ganglion cell layer; INL, inner nuclear layer; ONL, outer nuclear layer. L, M) Expression of FGF-2 and hsp25 proteins in 11–12-month-old WT and Tg retinas as evaluated by western immunoblotting. A single band of the expected molecular weight is apparent (representative 12 month samples are shown). Data (expressed as the mean±SEM, where n = 10) are normalized for actin and expressed relative to WT. Student’s unpaired t-tests revealed no significant difference between the treatment groups.
Fig.9
Fig.9
Analysis of heme oxygenase-1 (HO-1) expression in WT and Tg retinas. A) Expression of HO-1 protein in 12-month-old WT and Tg retinas as evaluated by western immunoblotting. An intense, single band of the expected molecular weight (32 kD) is apparent in an extract from a retinal culture treated with the pro-oxidant hydrogen peroxide (+ve). In WT and Tg retinas, a faint band of the correct molecular weight is evident. B) Representative images of HO-1 labeling in a retina subjected to branch retinal vein occlusion (BRVO, +ve control), and in 12-month-old WT and Tg retinas. HO-1 immunoreactivity is associated with astrocytes and Müller cells (arrows) in the retina analyzed 1d after induction of BRVO, and in activated microglia in the retina analyzed four days after induction of BRVO. Note: the area of retina shown is immediately adjacent to the vein occlusion site and not directly affected. No HO-1-positive cells are evident in WT or Tg retinas. Scale bar: 50 μm. GCL, ganglion cell layer; IPL, inner plexiform layer; INL, inner nuclear layer.
Fig.10
Fig.10
Representative images of p-cJUN and cFOS immunolabeling in 11-month-old WT and Tg retinas. A, B, E, F) Representative images of p-cJUN and cFOS labeling in a retina subjected to branch retinal vein occlusion (BRVO, positive controls) one day previously. p-cJUN (A, B) and cFOS (E, F) are upregulated by Müller cells (yellow arrows), astrocytes (yellow arrowheads), and RGCs (black arrows). Note: the areas of retina shown are not directly affected by the venous occlusion. C, D, G, H) No intensely labeled p-cJUN- or cFOS-positive cells are evident in WT or Tg retinas. Scale bar: 50 μm. GCL, ganglion cell layer; INL, inner nuclear layer.
Fig.11
Fig.11
Analysis of hyperphosphorylated tau in WT and Tg retinas. Expression of tau, p-tau-T181, and p-tau-S262 proteins in 12-month-old WT and Tg retinas, as evaluated by western immunoblotting. Representative blots are shown from 12-month-old animals. Tau is abundant in extracts from WT and Tg retinas. In contrast, no unambiguous bands of the correct molecular weight are evident when membranes are incubated with antibodies directed against p-tau-T181 and p-tau-S262. Intense, single bands of the expected molecular weights are, however, apparent in an extract from a retinal culture treated with the potent phosphatase inhibitor calyculin A (+ve).

References

    1. Goedert M, Spillantini MG (2006) A century of Alzheimer’s disease. Science 314, 777–781. - PubMed
    1. Puzzo D, Gulisano W, Palmeri A, Arancio O (2015) Rodent models for Alzheimer’s disease drug discovery. Expert Opin Drug Discov 10, 703–711. - PMC - PubMed
    1. Javaid FZ, Brenton J, Guo L, Cordeiro MF (2016) Visual and ocular manifestations of Alzheimer’s disease and their use as biomarkers for diagnosis and progression. Front Neurol 7, 55. - PMC - PubMed
    1. Krantic S, Torriglia A (2014) Retina: Source of the earliest biomarkers for Alzheimer’s disease? J Alzheimers Dis 40, 237–243. - PubMed
    1. London A, Benhar I, Schwartz M (2013) The retina as a window to the brain-from eye research to CNS disorders. Nat Rev Neurol 9, 44–53. - PubMed

Publication types

MeSH terms

LinkOut - more resources