. 2016 Dec 28;18(1):50.
doi: 10.3390/ijms18010050.

Monitoring the Response of Hyperbilirubinemia in the Mouse Brain by In Vivo Bioluminescence Imaging

Affiliations

Monitoring the Response of Hyperbilirubinemia in the Mouse Brain by In Vivo Bioluminescence Imaging

Isabella Manni et al. Int J Mol Sci. .

Abstract

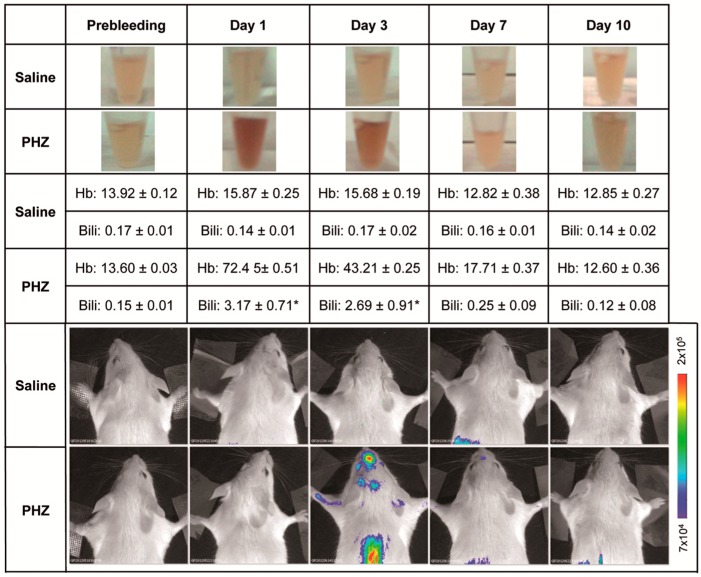
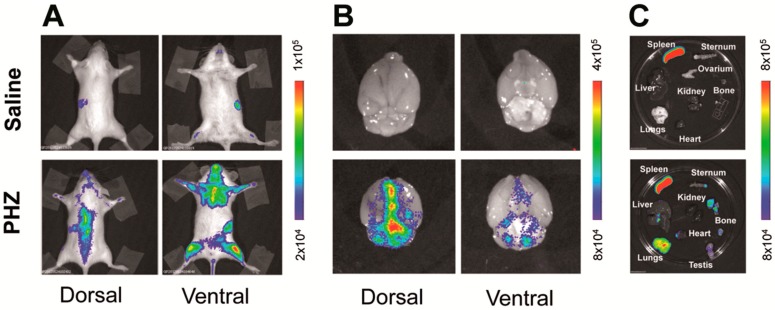
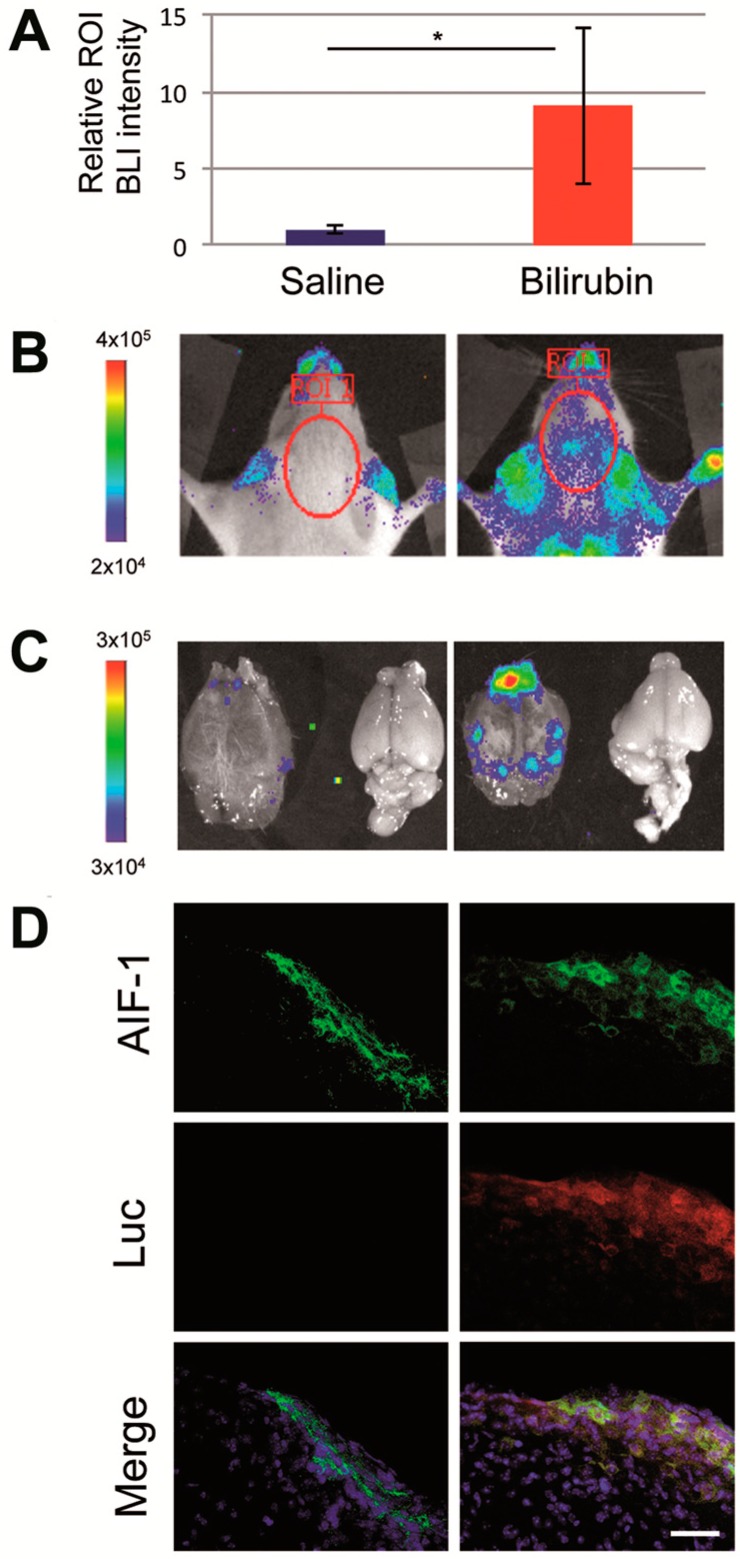
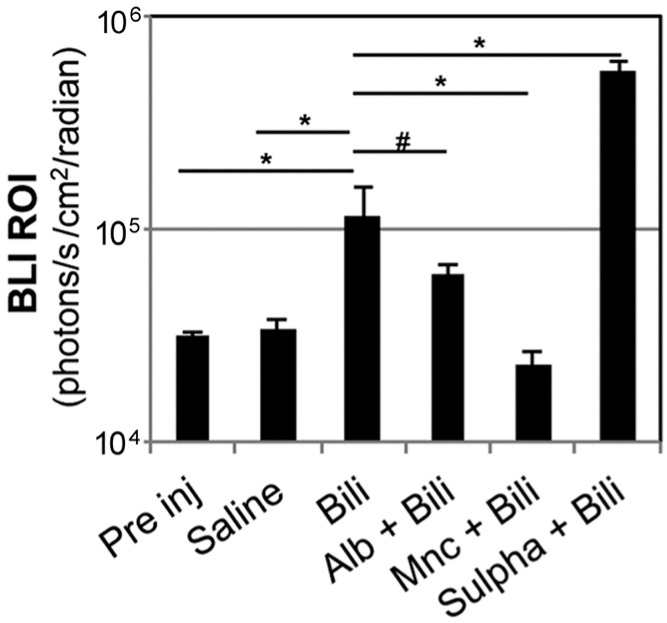
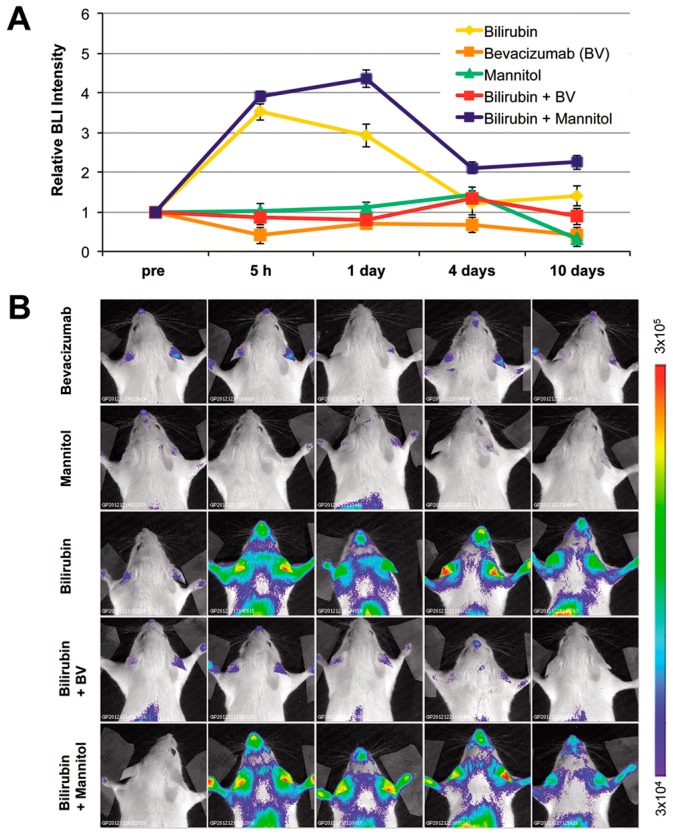
Increased levels of unconjugated bilirubin are neurotoxic, but the mechanism leading to neurological damage has not been completely elucidated. Innovative strategies of investigation are needed to more precisely define this pathological process. By longitudinal in vivo bioluminescence imaging, we noninvasively visualized the brain response to hyperbilirubinemia in the MITO-Luc mouse, in which light emission is restricted to the regions of active cell proliferation. We assessed that acute hyperbilirubinemia promotes bioluminescence in the brain region, indicating an increment in the cell proliferation rate. Immunohistochemical detection in brain sections of cells positive for both luciferase and the microglial marker allograft inflammatory factor 1 suggests proliferation of microglial cells. In addition, we demonstrated that brain induction of bioluminescence was altered by pharmacological displacement of bilirubin from its albumin binding sites and by modulation of the blood-brain barrier permeability, all pivotal factors in the development of bilirubin-induced neurologic dysfunction. We also determined that treatment with minocycline, an antibiotic with anti-inflammatory and neuroprotective properties, or administration of bevacizumab, an anti-vascular endothelial growth factor antibody, blunts bilirubin-induced bioluminescence. Overall the study supports the use of the MITO-Luc mouse as a valuable tool for the rapid response monitoring of drugs aiming at preventing acute bilirubin-induced neurological dysfunction.

Keywords: bevacizumab; bilirubin; bilirubin-induced neurologic dysfunction; blood–brain barrier; hyperbilirubinemia; in vivo bioluminescence imaging; kernicterus; luciferase; transgenic mice.


Conflict of interest statement

The authors declare no conflict of interest.

Figures

Figure 1
Figure 1
Effect of phenylhydrazine administration into MITO-Luc mice. Saline solution (saline) as control or phenylhydrazine (PHZ) (75 mg/kg) was administered via intra peritoneal route to MITO-Luc mice (n = 5 per group) to induce experimental hemolysis. At different time points, we collected blood samples by retro-orbital bleeding. The figure shows photographs of about 20 µL of serum from a representative animal from each group (top rows) and serum levels of hemoglobin (Hb, expressed in g/dL) and total bilirubin (Bili, expressed in mg/dL) (middle rows). Blood samples collected from the animals 3 days before treatment (referred as “prebleeding” in figure) were used as physiological baseline control. Data are mean ± SEM. Normal clinical chemistry values are: total bilirubin 0.1–0.7 mg/dL; hemoglobin 12–16 g/dL. Due to the fact that hemolysis interferes with accurate bilirubin determination, values indicated with an asterisk (*) should be considered approximated values. The bottom part of the figure shows the in vivo bioluminescence imaging of a representative animal for each group performed at the same time points. The color bar and numbers next to the image illustrate the relative bioluminescent signal intensities from the lowest (blue) to the highest (red), with minimal and maximal values expressed in photons per second per square centimeter per steradian (photons/s/cm2/sr).
Figure 2
Figure 2
Phenylhydrazine administration modulates bioluminescence in vivo and ex vivo in MITO-Luc mice. MITO-Luc mice receiving intra peritoneal administration of saline solution (saline) or phenylhydrazine (PHZ) 75 mg/kg for two consecutive days were analyzed by in vivo and ex vivo bioluminescence imaging (BLI) 3 days after the last PHZ administration. In particular, the figure shows in vivo BLI analysis of a representative animal from the control (top) and PHZ (bottom) treated groups (n = 3) (A); ex vivo BLI analysis of brains (B) and other organs (C) dissected from the same animals after necropsy. The color bars represent bioluminescent signals in radiance (photons/s/cm2/sr) from the lowest (blue) to the highest (red).
Figure 3
Figure 3
Effects of intra peritoneal injection of bilirubin into MITO-Luc mice. Representative MITO-Luc mouse (n = 5 per group) receiving saline solution or bilirubin (50 mg/kg) were analyzed 1 day after administration. (A) Relative bioluminescence intensity assessed by Living Imaging software; the asterisk (*) indicates a significant difference versus the control group (p ≤ 0.05); (B) bioluminescence imaging (BLI) of live animals; (C) BLI imaging of brain after necropsy. The color scale next to the images indicates radiance, with red and blue respectively representing the highest and lowest bioluminescent signals, expressed in photons/s/cm2/sr; (D) Representative immunohistochemical images of lateral sagittal brain sections including middbrain and substantia nigra from saline- (left panels) and bilirubin-treated mice (right panels), stained with antibodies anti-allograft inflammatory factor 1 (AIF-1, green), antibodies anti-luciferase (Luc, red), and relative merged images with 4′,6-diamidino-2-phenylindole (DAPI, blue) staining. Scale bar: 100 µm.
Figure 4
Figure 4
Effect of different pharmacological treatments on brain bioluminescence modulation. MITO-Luc mice received, in conjunction with bilirubin injection, one of the following treatments: daily intra peritoneal (i.p.) administration of human serum albumin (Alb) (2.5 g/kg body weight) for 2 days before bilirubin (Bili) administration (Alb + Bili group); administration of minocycline (Mnc) (50 mg/kg) i.p. 30 min before and 2 h after bilirubin injection (Mnc + Bili group); i.p. administration of sulphadimethoxine (Sulpha) (200 mg/kg body weight) 2 h before bilirubin administration (Sulpha + Bili group). Quantification of BLI signals in the regions of interest in the brain area were quantified 5 h after bilirubin administration and compared to the signal assessed in the same animals 3 days before the administration of the different substances (referred as “Pre inj” for “pre injection”), and with a group of animals receiving saline solution only (Saline). n = 25 at the pre injection assessment; then the animals were randomly divided in groups of 5 mice each. The significance of differences of the bilirubin group (Bili) vs. the controls and experimental groups are shown. In particular, (*) indicates p ≤ 0.05; (#) p > 0.05 between bilirubin and albumin + bilirubin groups.
Figure 5
Figure 5
Effect of alteration of blood–brain barrier permeability. Before bilirubin administration, MITO-Luc mice were pretreated with mannitol (3 mL of 25% mannitol/100 g body weight) or bevacizumab (25 mg/kg body weight) and bioluminescence imaging analysis (BLI) was performed at different time points. (A) Quantification of BLI signals in selected regions of interest in the brain area. Statistical analysis revealed significant differences (p ≤ 0.05) of the bilirubin group vs. bilirubin + bevacizumab group at the 5 h and 1 day time points; (B) BLI analysis of one representative animal out of five per group, at the different time points. The color bar and numbers illustrate the relative bioluminescent signal intensities from the lowest (blue) to the highest (red), with minimal and maximal values expressed in photons/s/cm2/sr.

References

    1. Shapiro S.M. Definition of the clinical spectrum of kernicterus and bilirubin-induced neurologic dysfunction (BIND) J. Perinatol. 2005;25:54–59. doi: 10.1038/sj.jp.7211157. - DOI - PubMed
    1. Bhutani V.K., Johnson-Hamerman L. The clinical syndrome of bilirubin-induced neurologic dysfunction. Semin. Fetal Neonatal Med. 2015;20:6–13. doi: 10.1016/j.siny.2014.12.008. - DOI - PubMed
    1. Gazzin S., Strazielle N., Tiribelli C., Ghersi-Egea J.F. Transport and metabolism at blood–brain interfaces and in neural cells: Relevance to bilirubin-induced encephalopathy. Front. Pharmacol. 2012;3:89. doi: 10.3389/fphar.2012.00089. - DOI - PMC - PubMed
    1. Palmela I., Sasaki H., Cardoso F.L., Moutinho M., Kim K.S., Brites D., Brito M.A. Time-dependent dual effects of high levels of unconjugated bilirubin on the human blood–brain barrier lining. Front. Cell. Neurosci. 2012;6:22. doi: 10.3389/fncel.2012.00022. - DOI - PMC - PubMed
    1. Wennberg R.P. The blood–brain barrier and bilirubin encephalopathy. Cell. Mol. Neurobiol. 2000;20:97–109. - PMC - PubMed