Observational Study
. 2017 Aug 1;196(3):328-339.
doi: 10.1164/rccm.201608-1685OC.

Shared and Distinct Aspects of the Sepsis Transcriptomic Response to Fecal Peritonitis and Pneumonia

Affiliations
Observational Study

Shared and Distinct Aspects of the Sepsis Transcriptomic Response to Fecal Peritonitis and Pneumonia

Katie L Burnham et al. Am J Respir Crit Care Med. .

Abstract

Rationale: Heterogeneity in the septic response has hindered efforts to understand pathophysiology and develop targeted therapies. Source of infection, with different causative organisms and temporal changes, might influence this heterogeneity.

Objectives: To investigate individual and temporal variations in the transcriptomic response to sepsis due to fecal peritonitis, and to compare these with the same parameters in community-acquired pneumonia.

Methods: We performed genome-wide gene expression profiling in peripheral blood leukocytes of adult patients admitted to intensive care with sepsis due to fecal peritonitis (n = 117) or community-acquired pneumonia (n = 126), and of control subjects without sepsis (n = 10).

Measurements and main results: A substantial portion of the transcribed genome (18%) was differentially expressed compared with that of control subjects, independent of source of infection, with eukaryotic initiation factor 2 signaling being the most enriched canonical pathway. We identified two sepsis response signature (SRS) subgroups in fecal peritonitis associated with early mortality (P = 0.01; hazard ratio, 4.78). We defined gene sets predictive of SRS group, and serial sampling demonstrated that subgroup membership is dynamic during intensive care unit admission. We found that SRS is the major predictor of transcriptomic variation; a small number of genes (n = 263) were differentially regulated according to the source of infection, enriched for IFN signaling and antigen presentation. We define temporal changes in gene expression from disease onset involving phagosome formation as well as natural killer cell and IL-3 signaling.

Conclusions: The majority of the sepsis transcriptomic response is independent of the source of infection and includes signatures reflecting immune response state and prognosis. A modest number of genes show evidence of specificity. Our findings highlight opportunities for patient stratification and precision medicine in sepsis.

Keywords: gene expression; immune; patient stratification; septic.


Figures
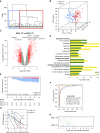
Figure 1.
Figure 1.
Transcriptomic sepsis response signatures (SRSs) in fecal peritonitis (FP). (A) Unsupervised hierarchical clustering analysis of 147 FP samples for the top 10% most variable probes (n = 2,716). (B) First three principal components (PCs) plotted with the proportion of variance explained by each component, with samples colored by SRS group membership assigned by hierarchical and k-means clustering. (C) Volcano plot of differentially expressed probes for SRS1_FP versus SRS2_FP (red coloring shows fold change >1.5, false discovery rate <0.05). (D) Enriched functions, disease phenotypes, and predicted upstream regulators derived from differentially expressed probes in FP SRS groups and compared with the previously published community-acquired pneumonia (CAP) dataset. Enrichment was also seen for an endotoxin tolerance gene expression signature we previously defined (5) using publicly available datasets (42, 43) in SRS1_FP relative to SRS2_FP, tested using ROAST (rotation gene set testing), a gene set enrichment test (P < 1 × 10−5). (E) Kaplan-Meier survival plot by SRS group (shaded areas, 95% confidence intervals [CIs]) with a single sample selected at random for those patients with multiple samples to assign SRS membership. (F) The performance of the SRS group assignment models (gene sets) which were derived and tested in the FP and previously published CAP datasets, are shown by receiver operating characteristic curves, and the area under the curve (AUC) is given for each. (G) Time course of patient SRS-FP group membership using serial samples and days from disease onset. (H) Expression of CD163 over time from disease onset in samples from the 11 patients with FP who moved between SRS groups. Each point represents a sample, colored according to SRS group assignment, with lines linking samples from the same patient. HR = hazard ratio.
Figure 2.
Figure 2.
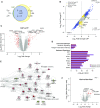
Transcriptomic response to sepsis. (A) First two principal components (PCs) of gene expression data plotted with the proportion of variance explained by each component shown. Solid circles represent fecal peritonitis (FP) discovery samples (n = 94), and open circles represent community-acquired pneumonia (CAP) discovery samples (n = 127). Samples are colored according to sepsis response signature (SRS) group assignment, showing that sepsis response states have considerable overlap between sources of infection. Control subjects (n = 10) are indicated by x. (B) Heatmap showing correlation between the first six PCs, SRSs, and clinical covariates for sepsis samples (FP, n = 94; CAP, n = 127). (C) Venn diagram showing the overlap in differential gene expression versus control subjects in the sepsis response and the response to trauma (false discovery rate [FDR], <0.05; fold change [FC], >1.5; first 5 d). Selected condition-specific enriched pathways and biological functions are noted. (D) Volcano plot of differentially expressed probes for FP (n = 94; left) and CAP (n = 127; right) versus control subjects (n = 10) (red coloring shows FC >1.5, FDR <0.05). APACHE = Acute Physiology and Chronic Health Evaluation; EIF2 = eukaryotic initiation factor 2; NFAT = nuclear factor of activated T cells; SOFA = Sequential Organ Failure Assessment; TNFR1 = tumor necrosis factor receptor 1.
Figure 3.
Figure 3.
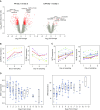
Variation in the sepsis transcriptome according to source of infection. (A) Venn diagram showing the overlap in the fecal peritonitis (FP) and community-acquired pneumonia (CAP) sepsis response in terms of the number of differentially expressed genes versus control subjects (FP, n = 64 samples; CAP, n = 73 samples; control subjects, n = 10 samples). (B) Correlation of differential gene expression (DE) between sepsis due to FP (n = 64 samples) and control subjects (n = 10 samples), and sepsis due to CAP (n = 73 samples) and control subjects (n = 10 samples). (C) Volcano plot of differentially expressed probes for CAP versus FP (red coloring shows fold change [FC] >1.5, FDR <0.05; positive fold change indicates relative upregulation in CAP). (D) Enriched pathways and predicted upstream regulators derived from differentially expressed genes for CAP versus FP in the discovery (CAP, n = 73 samples; FP, n = 64 samples) and validation cohorts (CAP, n = 53 samples; FP, n = 53 samples). (E) Most significantly enriched network (P = 1 × 10−39), based on comparison of CAP versus FP with differentially expressed genes shaded (red = upregulation; green = downregulation), and logarithmic FC with P value shown for each gene. (F) Volcano plot of the differentially expressed probes for positive viral diagnosis (n = 25) versus no positive viral diagnosis (n = 240) in 265 patients with CAP. Red coloring indicates FC less than 1.5, FDR less than 0.05. IRF = IFN regulatory factor; MHC = major histocompatibility complex; STAT = signal transducer and activator of transcription; TNF = tumor necrosis factor.
Figure 4.
Figure 4.
Dynamics of gene expression in sepsis due to fecal peritonitis (FP) and community-acquired pneumonia (CAP). (A) Volcano plot of the differentially expressed probes for Day 1 versus Day 5 samples from the same patient in FP (n = 9; left) and CAP (right; n = 17) (red coloring indicates fold change >1.5 and false discovery rate <0.05). (B) Examples of genes showing significant temporal variation in expression over time for patients with sepsis due to FP include the kinase activator CDK5R1 and complement component C1QB; other examples are the adhesion receptor EMR3 and cysteine protease CAPN13. (C) Examples of genes showing variation in expression over time for patients with sepsis due to CAP include cell cycle gene NIT2 and the hematopoiesis regulatory transcription factor gene MYB; other examples are the antimicrobial neutrophil peptidase CTSG, inflammatory regulator CAMP, defensin DEFA4, and neutrophil granule elastase ELANE. (D) Further examples of genes differentially expressed in FP over time plotted from time of onset of FP include the adaptor-related protein complex 2–associated kinase 1 (AAK1), involved in regulating clathrin-mediated endocytosis (44), which is critical for bacterial entry (45), as well as SNN encoding stannin, a mitochondrial damage sensor (46).

Comment in

References

    1. Singer M, Deutschman CS, Seymour CW, Shankar-Hari M, Annane D, Bauer M, Bellomo R, Bernard GR, Chiche JD, Coopersmith CM, et al. The Third International Consensus Definitions for Sepsis and Septic Shock (Sepsis-3) JAMA. 2016;315:801–810. - PMC - PubMed
    1. Marshall JC. Why have clinical trials in sepsis failed? Trends Mol Med. 2014;20:195–203. - PubMed
    1. Cohen J, Vincent JL, Adhikari NK, Machado FR, Angus DC, Calandra T, Jaton K, Giulieri S, Delaloye J, Opal S, et al. Sepsis: a roadmap for future research. Lancet Infect Dis. 2015;15:581–614. - PubMed
    1. Hotchkiss RS, Monneret G, Payen D. Sepsis-induced immunosuppression: from cellular dysfunctions to immunotherapy. Nat Rev Immunol. 2013;13:862–874. - PMC - PubMed
    1. Davenport EE, Burnham KL, Radhakrishnan J, Humburg P, Hutton P, Mills TC, Rautanen A, Gordon AC, Garrard C, Hill AVS, et al. Genomic landscape of the individual host response and outcomes in sepsis: a prospective cohort study. Lancet Respir Med. 2016;4:259–271. - PMC - PubMed

Publication types