. 2017 Feb 14;8(7):11641-11658.
doi: 10.18632/oncotarget.14264.

MicroRNA 603 acts as a tumor suppressor and inhibits triple-negative breast cancer tumorigenesis by targeting elongation factor 2 kinase

Affiliations

MicroRNA 603 acts as a tumor suppressor and inhibits triple-negative breast cancer tumorigenesis by targeting elongation factor 2 kinase

Recep Bayraktar et al. Oncotarget. .

Abstract

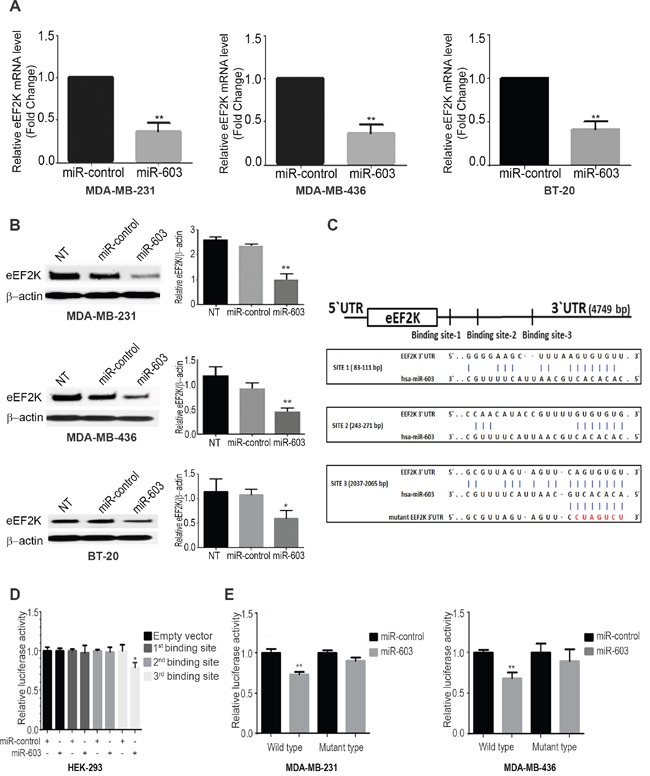
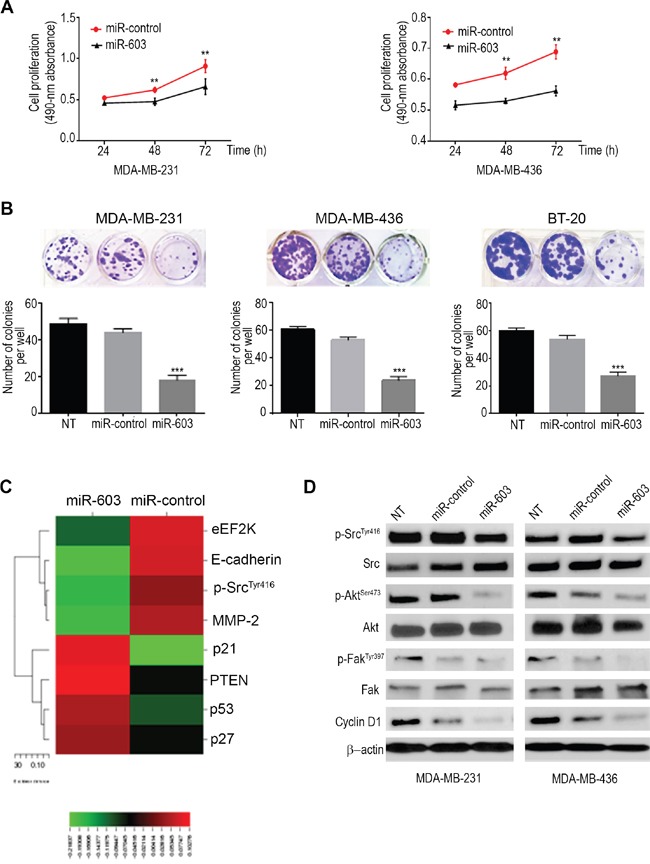
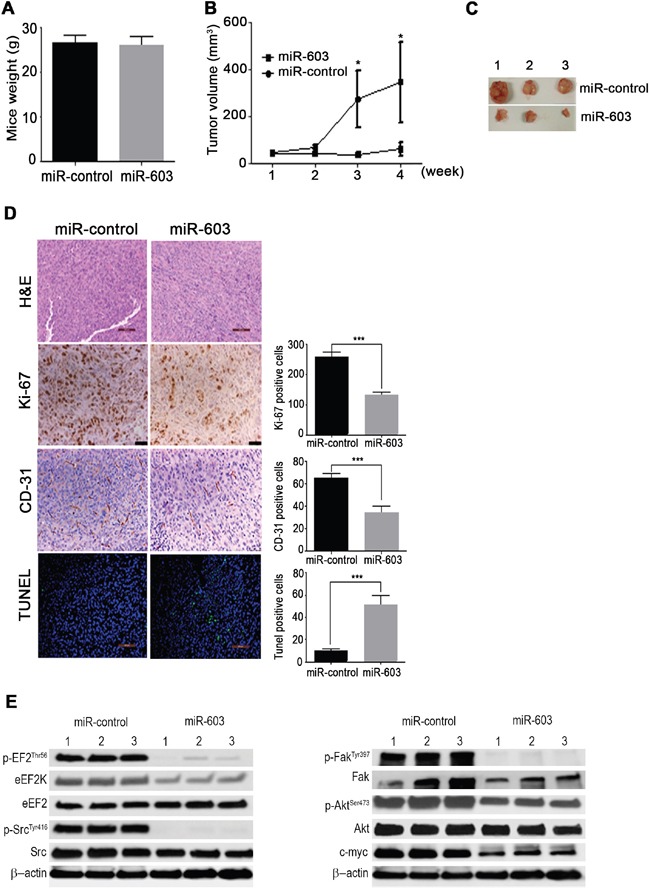
Triple negative breast cancer (TNBC) is an aggressive type of breast cancer characterized by the absence of defined molecular targets, including estrogen receptor (ER), progesterone receptor (PR), human epidermal growth factor receptor 2 (HER2) and is associated with high rates of relapse and distant metastasis despite surgery and adjuvant chemotherapy. The lack of effective targeted therapies for TNBC represents an unmet therapeutic challenge. Eukaryotic elongation factor 2 kinase (eEF2K) is an atypical calcium/calmodulin-dependent serine/threonine kinase that promotes TNBC tumorigenesis, progression, and drug resistance, representing a potential novel molecular target. However, the mechanisms regulating eEF2K expression are unknown. Here, we report that eEF2K protein expression is highly up-regulated in TNBC cells and patient tumors and it is associated with poor patient survival and clinical outcome. We found that loss/reduced expression of miR-603 leads to eEF2K overexpression in TNBC cell lines. Its expression results in inhibition of eEF2K by directly targeting the 3-UTR and the inhibition of tumor cell growth, migration and invasion in TNBC. In vivo therapeutic gene delivery of miR-603 into TNBC xenograft mouse models by systemic administration of miR-603-nanoparticles led to a significant inhibition of eEF2K expression and tumor growth, which was associated with decreased activity of the downstream targets of eEF2K, including Src, Akt, cyclin D1 and c-myc. Our findings suggest that miR-603 functions as a tumor suppressor and loss of miR-603 expression leads to increase in eEF2K expression and contributes to the growth, invasion, and progression of TNBC. Taken together, our data suggest that miR-603-based gene therapy is a potential strategy against TNBC.

Keywords: eEF2K; liposomes; miR-603; nanoparticles; triple negative breast cancer.


Conflict of interest statement

CONFLICTS OF INTEREST

The authors declare that they have no conflicts of interest with the contents of this article.

Figures

Figure 1
Figure 1. eEF2K protein and mRNA is overexpressed in TNBC cell lines and patients tumor samples
A. eEF2K protein expression levels in TNBC cell lines were higher than in the normal breast epithelial cells (MCF-10A). B. The expression levels of eEF2K in patient tumor tissues and adjacent normal tissues were determined by immunohistochemistry C. High protein expression of eEF2K was associated with poor overall survival in breast cancers patients with low and high eEF2K expression, log-rank p = 0.0398) as determined by Kaplan-Meier analysis. D. Relative expression levels of eEF2K mRNA in TNBC cell lines were analyzed with qPCR. E. The algorithms including TargetScan, miRDB, Diana microT, and microRNA predict that the 3’-UTR of eEF2K is targeted by miR-603. F. Relative expression levels of miR-603 in TNBC cell lines and in MCF-10A cells were quantified by qPCR using specific primers. The data were normalized to the expression of U6 small nuclear RNA and are shown as means with SDs for three independent experiments.
Figure 2
Figure 2. miR-603 negatively regulates eEF2K expression levels in TNBC cells by directly binding to the eEF2K 3’-UTR
A. miR-603 expression leads to decreased eEF2K mRNA expression levels in MDA-MB-231, MDA-MB-436 and BT-20 in TNBC cells. Cells lines were analyzed for eEF2K mRNA levels by qPCR 48 h after miR-603 transfection. B. miR-603 expression decreases eEF2K protein expression levels in MDA-MB-231, MDA-MB-436 and BT-20 cells. TNBC cells were transfected with the miR-603 mimic or miR-control, and eEF2K protein levels were analyzed by Western blotting 72 h after transfection. B-Actin was used as a loading control. Band intensities were quantified using densitometric analysis (right panel, NT, not transfected. C. Three predicted binding sites of miR-603 in the 3’-UTR of human wild-type eEF2K and their sequences. Mutations in the seed sequence of the full-length eEF2K 3’-UTR are shown in red. D, E. Luciferase reporter assay showed that miR-603 directly targets the eEF2K 3’-UTR-luciferase reporter (wild type or mutant miR-603 binding sides), in HEK-293, MDA-MB-231 and MDA-MB-436 cells incubated with the miR-603 mimic for 48 h before analysis. The firefly luciferase activity of the reporter was normalized to the internal Renilla luciferase activity. The data are presented as means with SDs for three independent experiments. *p < 0.05.
Figure 3
Figure 3. Ectopic expression of miR-603 suppresses TNBC cell proliferation and clonogenic ability in vitro
A. The short term effects of ectopic expression of miR-603 on the proliferation of MDA-MB-231 and MDA-MB-436 cells examined by cell proliferation assay (MTS assay) are shown as growth curves. The data are means ± SDs (*p <0.05). B. Effects of overexpression of miR-603 on the colony formation or clonogenic ability of MDA-MB-231, MDA-MB-436 and BT-20 cells. Upper panels, representative culture dishes from a colony formation assay. A lower panel, the number of colonies formed was normalized to the number of colonies formed by the control miRNA (miR-control)-transfected cells. The data are means ± SDs. ***p < 0.001. C. A heat map of RPPA results revealed an array of altered proteins in MDA-MB-231 cells. The expression ratios for a given sample group of interest were represented by their mean. Rows, proteins; columns, signal ratios of miR-603- or control miRNA-transfected MDA-MB-231 cells. For each protein, the red color indicates that the expression level of that protein was higher in miR-603-transfected cells than in control miRNA-transfected cells, and the green color indicates that the expression level was lower. D.Western blot analysis of p-EF2 Thr56, p-Src Tyr416, total Src, p-FakTyr397, total Fak, p-Akt Ser473, total Akt and cyclinD1 in the indicated cells after 72-h of transfection. β-Actin was used as a loading control.
Figure 4
Figure 4. Transfection of TNBC cells with miR-603 suppresses migration and invasion of the cells in vitro
A. Morphological changes in MDA-MB-231 and MDA-MB-436 cells after 48-h transfection with 50 nM miR-603 or control miRNA. Representative phase contrast micrographs are shown. B. MDA-MB-231 and MDA-MB-436 cell lines that were transfected with miR-603, or miR-control or that did not undergo transfection (NT) were assessed for migration with the wound healing assay. After 72-h transfection, a wound was formed by scraping, and the area of the wound was measured at 0 and 36 h. The relative percentages of wound closure per field are shown on the right as means ± SDs. C. the invasiveness of MDA-MB-231, MDA-MB-436 and BT-20 cells was assessed by using a matrigel transwell assay. The cells were transfected with miR-603 or miR-control or not treated (NT). After 72-h transfection, the cells were transferred to transwell chambers and incubated for 24 h. The invading cells were counted, and mean ± SDs from triplicate experiments are shown on the right (***p < 0.001).
Figure 5
Figure 5. Knockdown of eEF2K by siRNA leads to inhibition of cell clonogenicity, migration, and invasion in vitro
A. The silencing of eEF2K by siRNA (50 nM) significantly reduced the number of colonies formed by MDA-MB-231 and MDA-MB-436 cells (***p < 0.001). Cells were transfected every 4 days with the control or eEF2K siRNA. B. MDA-MB-231 and MDA-MB-436 cell invasion was assessed by using a matrigel transwell assay. Cells were transfected with eEF2K siRNA or control siRNA or not transfected (NT)); after 72-h transfection, the cells were transferred to transwell and incubated for 24 h and cells invading matrigel and passing through the membrane we counted by light microscope. C. Western blot analysis of p-EF2Thr56, p-SrcTyr416, total Src, p-FakTyr397, total Fak, p-AktSer473, total Akt and cyclin D1 in the indicated cells. β-Actin was used as a loading control.
Figure 6
Figure 6. In vivo systemic administration of miR-603 nanoparticles inhibits growth TNBC xenografts in mice
A, B, C. MDA-MB-436 cells were orthotopically injected into the mammary fat pad of female athymic nude mice. The mice were then treated with either nanoliposomal control miRNA (miR-control) or miR-603 nanoparticles (0.3 mg/kg [8 μg/mouse] intravenously twice per week for 4 weeks; five mice per group). Tumor volumes were measured weekly and are shown as means ± SDs. miR-603 treatment did not cause any change in the mean mouse weight after 4 weeks. D. Samples of MDA-MB-436 tumors from the control and miR-603-treated mice were stained with hematoxylin and eosin. Scale bar = 100 μm. (D) Tumor cell proliferation and micro vessel density were analyzed by evaluating the expression of Ki-67 and CD-31, respectively, in tumor tissues by immunohistochemistry; D, In vivo induction of apoptosis was analyzed by TUNEL assay in MDA-MB-436 tumor xenografts. Magnification,×20. E. Western blot analysis demonstrated that silencing of eEF2K in MDA-MB-436 tumor samples reduced eEF2K, p-eEF2, p-Src, p-Akt, c-myc and p-Fak protein expression levels. β-Actin was used as a loading control.
Figure 7
Figure 7. Schematic model of the regulatory pathways involving miR-603 and eEF2K in triple-negative breast cancer

References

    1. Ferlay J, Steliarova-Foucher E, Lortet-Tieulent J, Rosso S, Coebergh JW, Comber H, Forman D, Bray F. Cancer incidence and mortality patterns in Europe: estimates for 40 countries in 2012. European journal of cancer. 2013;49:1374–1403. - PubMed
    1. DeSantis C, Ma J, Bryan L, Jemal A. Breast cancer statistics, 2013. CA Cancer J Clin. 2014;64:52–62. - PubMed
    1. Perou CM, Sorlie T, Eisen MB, van de Rijn M, Jeffrey SS, Rees CA, Pollack JR, Ross DT, Johnsen H, Akslen LA, Fluge O, Pergamenschikov A, Williams C, Zhu SX, Lonning PE, Borresen-Dale AL, et al. Molecular portraits of human breast tumours. Nature. 2000;406:747–752. - PubMed
    1. Dawood S. Triple-negative breast cancer: epidemiology and management options. Drugs. 2010;70:2247–2258. - PubMed
    1. Foulkes WD, Smith IE, Reis-Filho JS. Triple-negative breast cancer. The New England journal of medicine. 2010;363:1938–1948. - PubMed

MeSH terms