

Real-time forecasting of infectious disease dynamics with a stochastic semi-mechanistic model
- PMID: 28038870
- PMCID: PMC5871642
- DOI: 10.1016/j.epidem.2016.11.003
Real-time forecasting of infectious disease dynamics with a stochastic semi-mechanistic model
Abstract
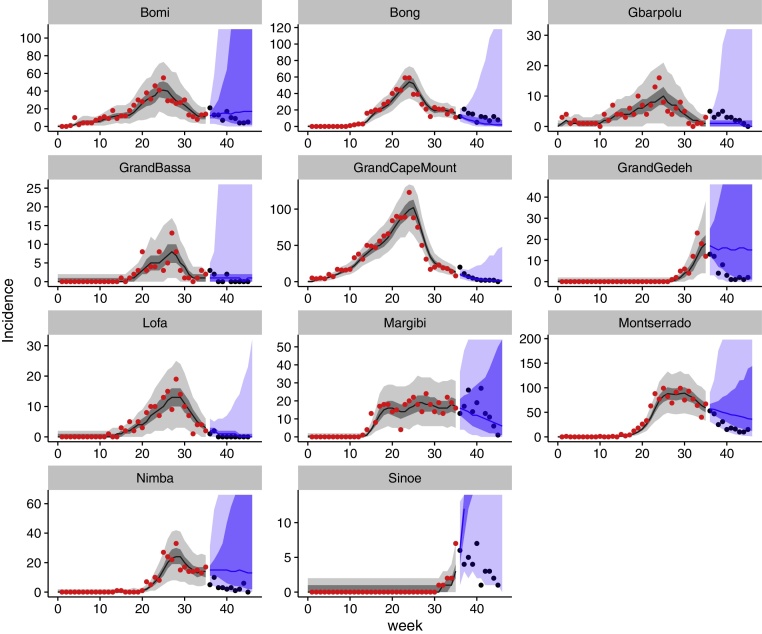
Real-time forecasts of infectious diseases can help public health planning, especially during outbreaks. If forecasts are generated from mechanistic models, they can be further used to target resources or to compare the impact of possible interventions. However, paremeterising such models is often difficult in real time, when information on behavioural changes, interventions and routes of transmission are not readily available. Here, we present a semi-mechanistic model of infectious disease dynamics that was used in real time during the 2013-2016 West African Ebola epidemic, and show fits to a Ebola Forecasting Challenge conducted in late 2015 with simulated data mimicking the true epidemic. We assess the performance of the model in different situations and identify strengths and shortcomings of our approach. Models such as the one presented here which combine the power of mechanistic models with the flexibility to include uncertainty about the precise outbreak dynamics may be an important tool in combating future outbreaks.
Keywords: Forecasting; Infectious disease dynamics; Outbreak; Real-time modelling.
Copyright © 2016 The Author(s). Published by Elsevier B.V. All rights reserved.
Figures


References
-
- Andrieu C., Doucet A., Holenstein R. Particle Markov chain Monte Carlo methods. J. R. Stat. Soc. Ser. B. 2010;72(pt. 3):269–342.
-
- Camacho A., Kucharski A., Aki-Sawyerr Y., White M.A., Flasche S., Baguelin M., Pollington T., Carney J.R., Glover R., Smout E., Tiffany A., Edmunds W.J., Funk S. Temporal changes in Ebola transmission in Sierra Leone and implications for control requirements: a real-time modelling study. PLoS Curr. 2015;7 - PMC - PubMed
-
- Carroll M.W., Matthews D.A., Hiscox J.A., Elmore M.J., Pollakis G., Rambaut A., Hewson R., García-Dorival I., Bore J.A., Koundouno R., Abdellati S., Afrough B., Aiyepada J., Akhilomen P., Asogun D., Atkinson B., Badusche M., Bah A., Bate S., Baumann J., Becker D., Becker-Ziaja B., Bocquin A., Borremans B., Bosworth A., Boettcher J.P., Cannas A., Carletti F., Castilletti C., Clark S., Colavita F., Diederich S., Donatus A., Duraffour S., Ehichioya D., Ellerbrok H., Fernandez-Garcia M.D., Fizet A., Fleischmann E., Gryseels S., Hermelink A., Hinzmann J., Hopf-Guevara U., Ighodalo Y., Jameson L., Kelterbaum A., Kis Z., Kloth S., Kohl C., Korva M., Kraus A., Kuisma E., Kurth A., Liedigk B., Logue C.H., Ldtke A., Maes P., McCowen J., Mély S., Mertens M., Meschi S., Meyer B., Michel J., Molkenthin P., Muñoz-Fontela C., Muth D., Newman E.N.C., Ngabo D., Oestereich L., Okosun J., Olokor T., Omiunu R., Omomoh E., Pallasch E., Pályi B., Portmann J., Pottage T. Temporal and spatial analysis of the 2014–2015 Ebola virus outbreak in West Africa. Nature. 2015;524(7563):97–101. - PMC - PubMed
Publication types
MeSH terms
Grants and funding
LinkOut - more resources
Full Text Sources
Other Literature Sources
Medical
