. 2017 Jun 1;19(6):808-819.
doi: 10.1093/neuonc/now267.

Defining the temporal course of murine neurofibromatosis-1 optic gliomagenesis reveals a therapeutic window to attenuate retinal dysfunction

Affiliations

Defining the temporal course of murine neurofibromatosis-1 optic gliomagenesis reveals a therapeutic window to attenuate retinal dysfunction

Joseph A Toonen et al. Neuro Oncol. .

Erratum in

  • Corrigenda.
    [No authors listed] [No authors listed] Neuro Oncol. 2017 Jun 1;19(6):876-877. doi: 10.1093/neuonc/nox045. Neuro Oncol. 2017. PMID: 28510767 Free PMC article. No abstract available.

Abstract

Background: Optic gliomas arising in the neurofibromatosis type 1 (NF1) cancer predisposition syndrome cause reduced visual acuity in 30%-50% of affected children. Since human specimens are rare, genetically engineered mouse (GEM) models have been successfully employed for preclinical therapeutic discovery and validation. However, the sequence of cellular and molecular events that culminate in retinal dysfunction and vision loss has not been fully defined relevant to potential neuroprotective treatment strategies.

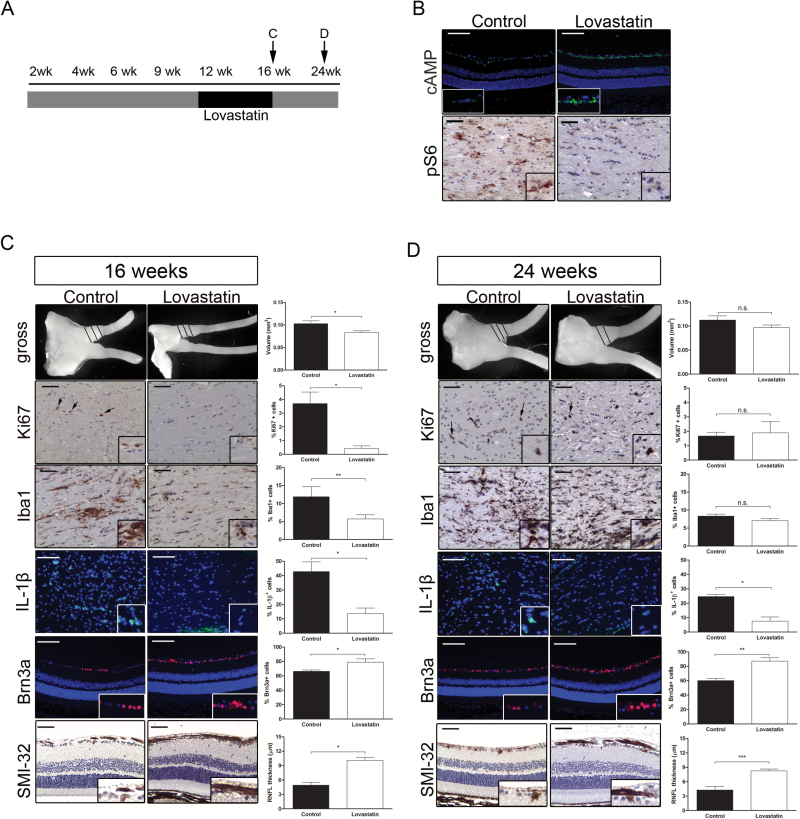
Methods: Nf1flox/mut GFAP-Cre (FMC) mice and age-matched Nf1flox/flox (FF) controls were euthanized at defined intervals from 2 weeks to 24 weeks of age. Optic nerve volumes were measured, and optic nerves/retinae analyzed by immunohistochemistry. Optical coherence tomography (OCT) was performed on anesthetized mice. FMC mice were treated with lovastatin from 12 to 16 weeks of age.

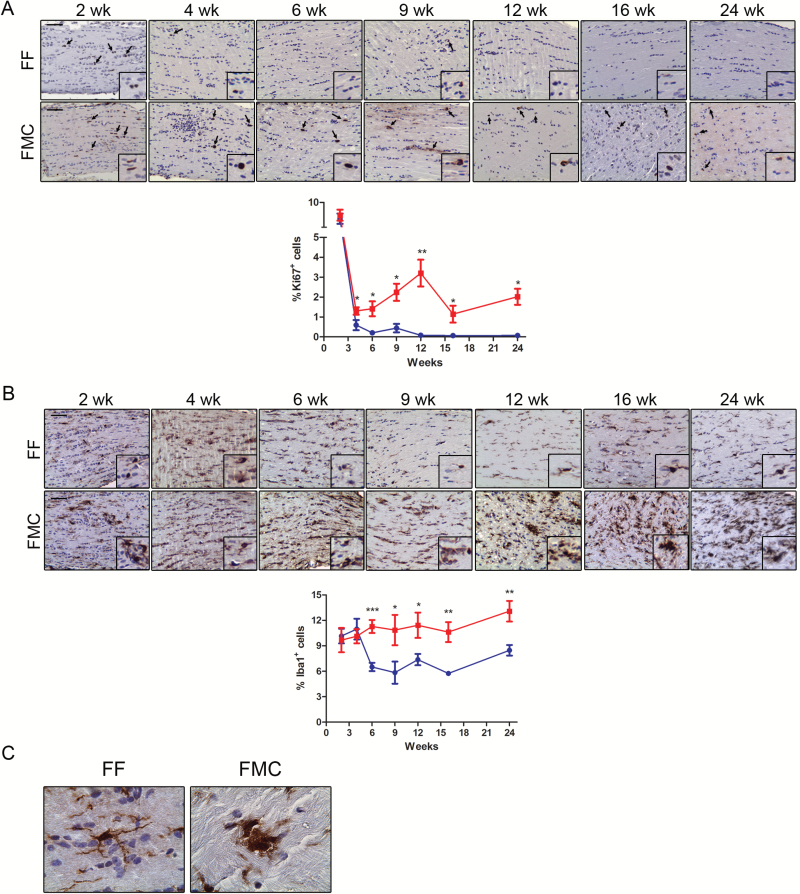
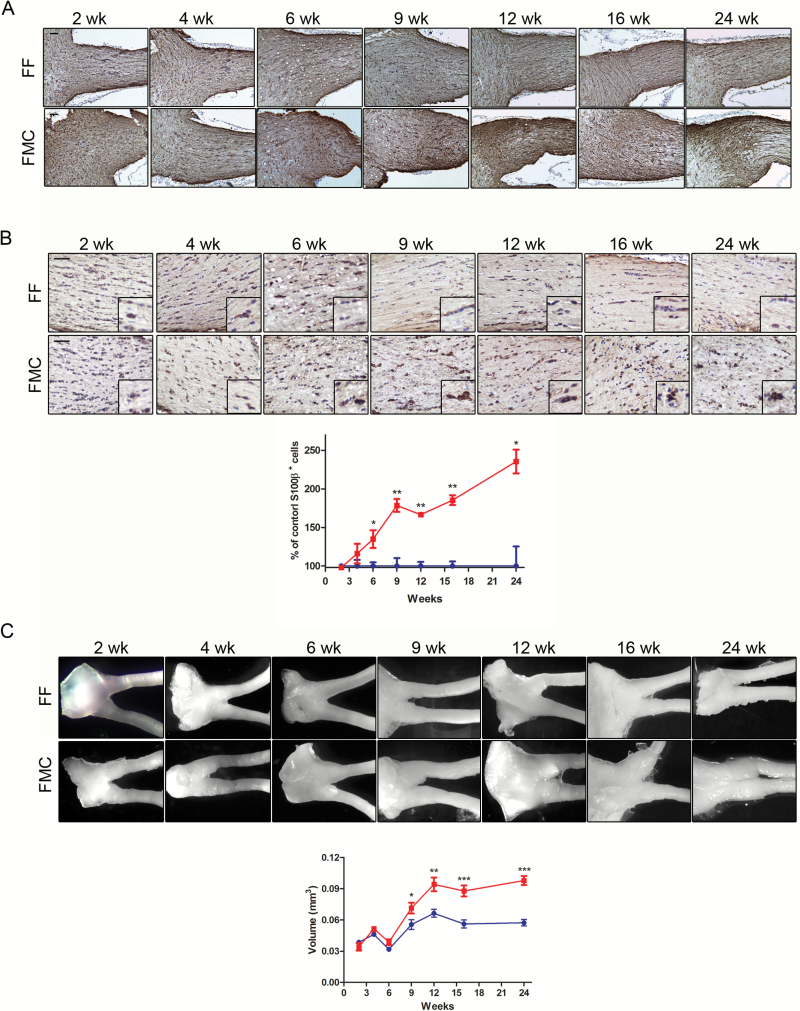
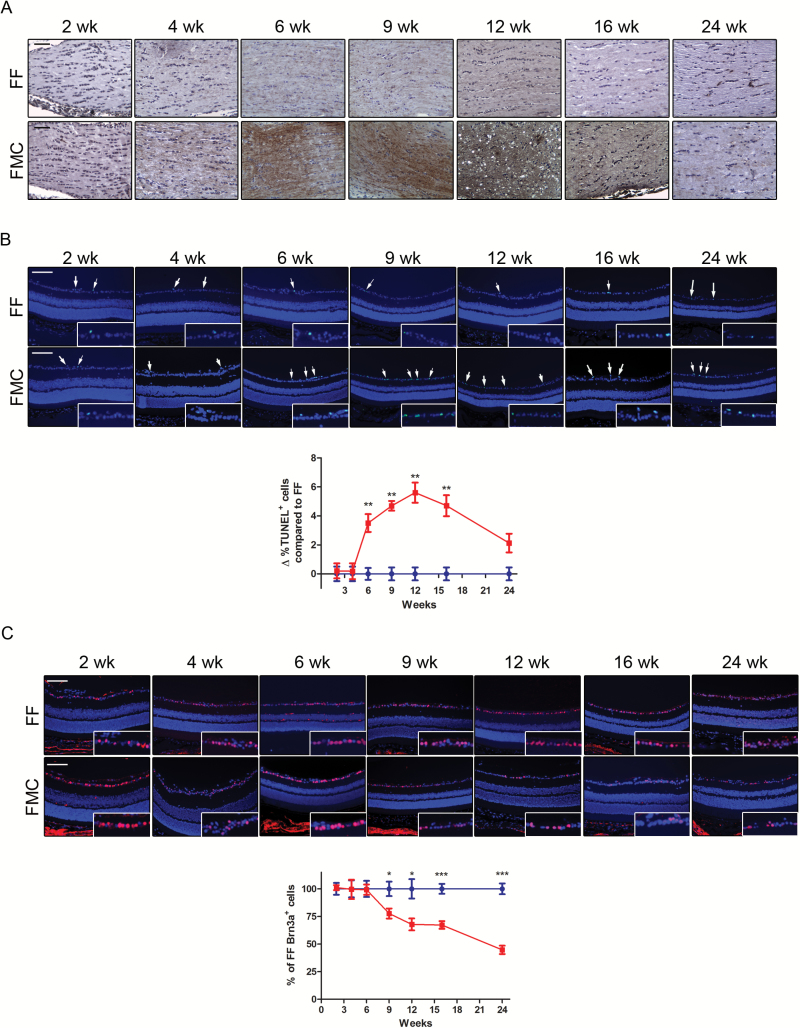
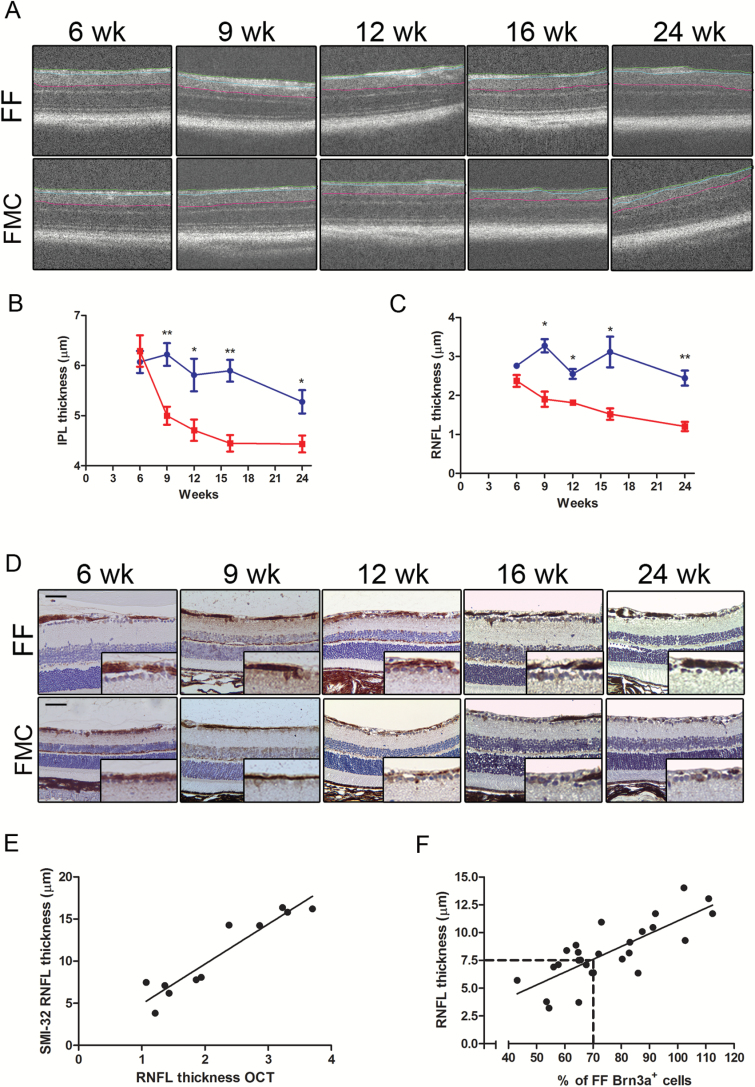
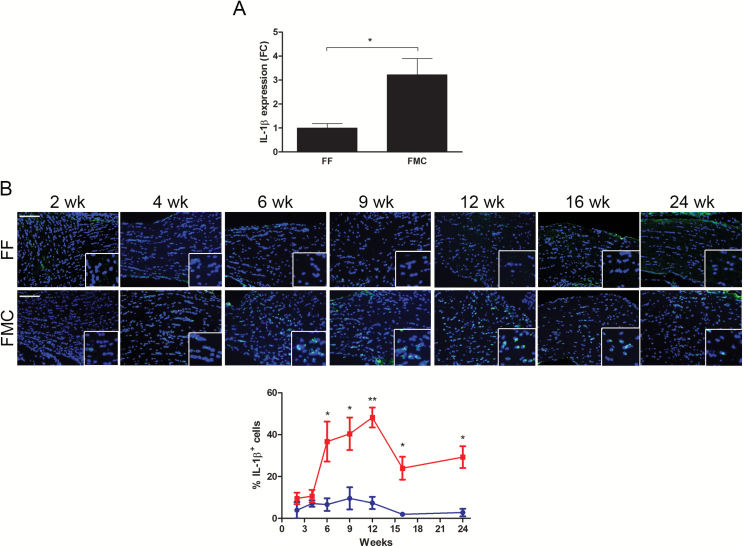
Results: The earliest event in tumorigenesis was a persistent elevation in proliferation (4 wk), which preceded sustained microglia numbers and incremental increases in S100+ glial cells. Microglia activation, as evidenced by increased interleukin (IL)-1β expression and morphologic changes, coincided with axonal injury and retinal ganglion cell (RGC) apoptosis (6 wk). RGC loss and retinal nerve fiber layer (RNFL) thinning then ensued (9 wk), as revealed by direct measurements and live-animal OCT. Lovastatin administration at 12 weeks prevented further RGC loss and RNFL thinning both immediately and 8 weeks after treatment completion.

Conclusion: By defining the chronology of the cellular and molecular events associated with optic glioma pathogenesis, we demonstrate critical periods for neuroprotective intervention and visual preservation, as well as establish OCT as an accurate biomarker of RGC loss.

Keywords: optic glioma; optical coherence tomography; pediatric brain tumor; retinal ganglion cell; retinal nerve fiber layer.


Figures

Fig. 1
Fig. 1
Increased proliferation and microglia are detected at 6 weeks of age in FMC mice. (A) Increased percentages of Ki67+ cells were observed in FMC relative to FF optic nerves, beginning at 4 weeks, and increasing from 6 to 12 weeks of age. The %Ki67+ cells subsequently decreased, but remained higher in FMC relative to FF optic nerves at 16 and 24 weeks. (B) The %Iba1+ cells (microglia) remained unchanged in FMC mice beginning at 6 weeks of age and beyond, whereas decreased numbers of microglia were observed in FF mice after 6 weeks of age. At least 6 mice per group were included for each time point. (C) Microglia in FF mice were ramified with elongated processes, while those in FMC mice exhibited amoeboid morphologies. Blue lines = FF, red lines = FMC, *P ≤ .05, **P ≤ .01, ***P ≤ .001. Graph denotes mean ± SEM. Scale bars = 50 µm.
Fig. 2
Fig. 2
Temporal progression of tumor formation in FMC mice. (A) GFAP immunostaining increased over time in FMC compared with FF optic nerves. (B) Increased percentages of S100β+ astrocytes were observed in FMC relative to FF optic nerves by 6 weeks of age, expressed as the %S100β+ cells relative to FF controls. S100β+ cells continued to increase thereafter. (C) Optic nerves and corresponding optic nerve volumes increased in FMC mice between 9 weeks and 12 weeks of age (n = 8). At least 6 mice per group were included for each time point. Blue lines = FF, red lines = FMC, *P ≤ .05,**P ≤ .01, P ≤ .001. Graph denotes mean ± SEM.
Fig. 3
Fig. 3
Axonal injury coincides with RGC death. (A) Phosphorylated NF-H staining reveals axonal damage by 6 weeks of age, which gradually decreases at 16 and 24 weeks in FMC relative to FF mice. (B) An increase in %TUNEL+ cells was observed by 6 weeks of age in FMC mice, which further increased at 9 and 12 weeks of age, before declining. Data represent a change from the mean %TUNEL+ cells in FF mice at each time point. (C) Brn3a+ cell (RGCs) loss begins at 9 weeks of age in FMC mice; 100% denotes the mean number of Brn3a+ cells in FF mice at each time point. At least 6 mice per group were included for each time point. Blue lines = FF, red lines = FMC, *P ≤ .05,**P ≤ .01, P ≤ .001. Graph denotes mean ± SEM. Scale bars = 50 µm.
Fig. 4
Fig. 4
OCT is an accurate biomarker of IPL-GCL and RNFL thinning. (A) OCT measured RNFL (green to blue line) and IPL-GCL (blue to pink line) thickness. (B) IPL-GCL thinning was first detected by OCT at 9 weeks of age in FMC mice, which progressed through 24 weeks of age. (C) RNFL thickness (OCT) was decreased in FMC mice by 9 weeks of age. (D) SMI-32 staining demonstrated similar results as obtained by OCT. (E) Linear regression scatter plot of SMI-32 and OCT (R2 = 0.889). (F) Linear regression scatter plot of RGC content and RNFL thinning (R2 = 0.609). Each data point is represented by comparing direct RNFL measurements with the mean number of Brn3a+ cells in FF mice at each time point. At least 6 mice per group were included for each time point. Blue lines = FF, red lines = FMC, *P ≤ .05,**P ≤ .01, P ≤ .001. Graph denotes mean ± SEM. Scale bars = 50 µm.
Fig. 5
Fig. 5
Nf1 optic glioma mice have more tumoral IL-1β expression. (A) The %IL-1β+ cells increased from 6 weeks to 12 weeks of age, but declined at 16 and 24 weeks of age. (B) Quantitative real-time PCR revealed 2.2-fold greater Il1b optic nerve RNA expression in 12-week-old FMC (n = 5) relative to FF (n = 3) mice. Data are represented as a fold change (FC) following normalization to H3f3a expression. *P ≤ .05.
Fig. 6
Fig. 6
Lovastatin attenuates retinal dysfunction. (A) Schematic of treatment schedule. (B) cAMP immunostaining in the RGC layer revealed increased cAMP levels (top) and decreased optic nerve pS6Ser240/244 immunoreactivity (bottom) following lovastatin treatment compared with controls. (C) Lovastatin treatment decreased the volumes, %Ki67+ cells, %Iba1+ cells, and %IL-1β+ cells in FMC optic nerves compared with controls immediately following treatment cessation (16 wk of age). There was also an increase in the %Brn3a+ cells and RNFL thickness (SMI-32 immunohistochemistry). (D) Mice treated with lovastatin for 4 weeks and euthanized 8 weeks later showed no differences in optic nerve volumes, %Ki67+ cells, or %Iba1+ cells relative to controls; however, the %IL-1β+ cells was reduced, and the %Brn3a+ cells and RNFL thickness (SMI-32 immunohistochemistry) were increased. Black = vehicle, white = lovastatin, *P ≤ .05,**P ≤ .01, P ≤ .001. Scale bars = 50 µm.

References

    1. Listernick R, Charrow J, Greenwald M, et al. Natural history of optic pathway tumors in children with neurofibromatosis type 1: a longitudinal study. J Pediatr. 1994;125(1):63–66. - PubMed
    1. Listernick R, Ferner RE, Liu GT, et al. Optic pathway gliomas in neurofibromatosis-1: controversies and recommendations. Ann Neurol. 2007;61(3):189–198. - PMC - PubMed
    1. Hyman SL, Shores A, North KN. The nature and frequency of cognitive deficits in children with neurofibromatosis type 1. Neurology. 2005;65(7):1037–1044. - PubMed
    1. Isenberg JC, Templer A, Gao F, et al. Attention skills in children with neurofibromatosis type 1. J Child Neurol. 2013;28(1):45–49. - PubMed
    1. Fisher MJ, Avery RA, Allen JC, et al. ; REiNS International Collaboration. Functional outcome measures for NF1-associated optic pathway glioma clinical trials. Neurology. 2013;81(21 Suppl 1):S15–S24. - PMC - PubMed

MeSH terms