. 2017 Feb 8;37(6):1453-1467.
doi: 10.1523/JNEUROSCI.0825-16.2016. Epub 2016 Dec 30.

A Model of the Superior Colliculus Predicts Fixation Locations during Scene Viewing and Visual Search

Affiliations

A Model of the Superior Colliculus Predicts Fixation Locations during Scene Viewing and Visual Search

Hossein Adeli et al. J Neurosci. .

Abstract

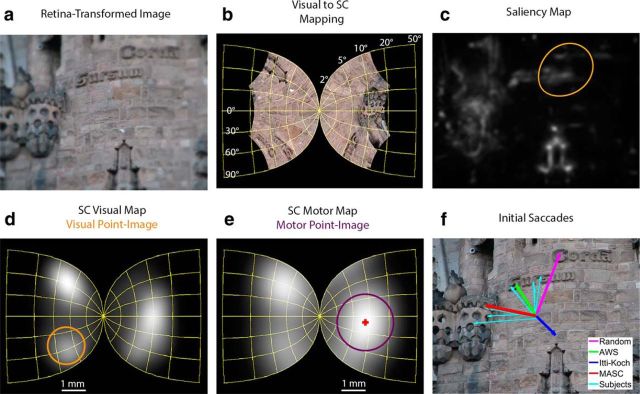
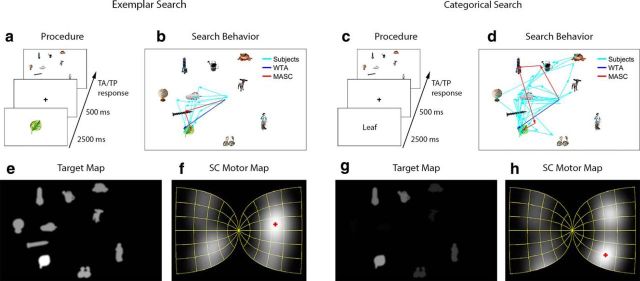
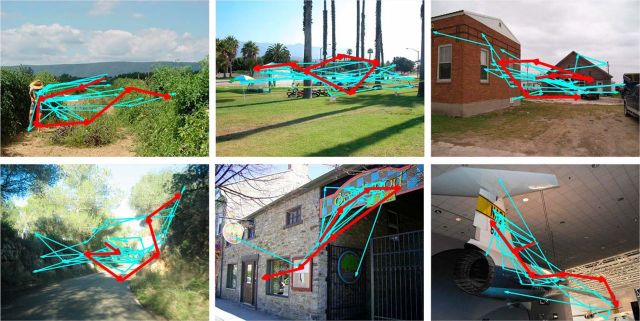
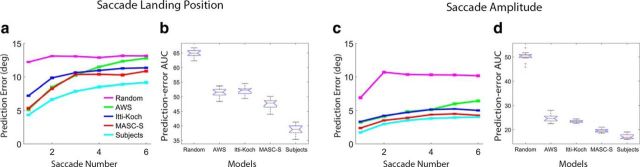
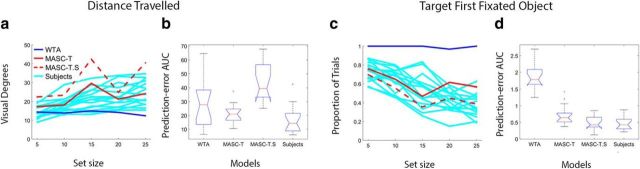
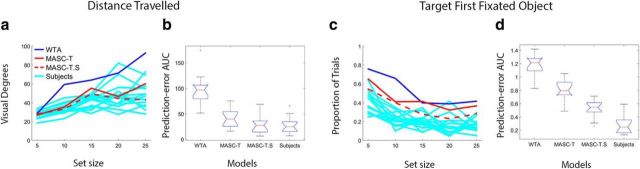
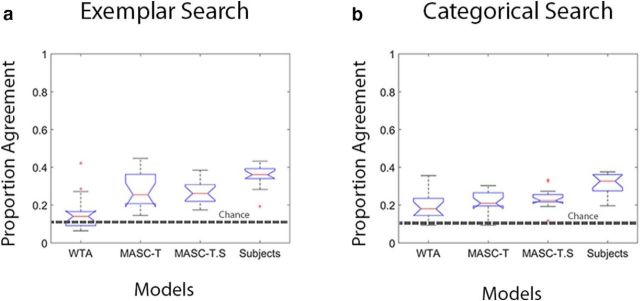
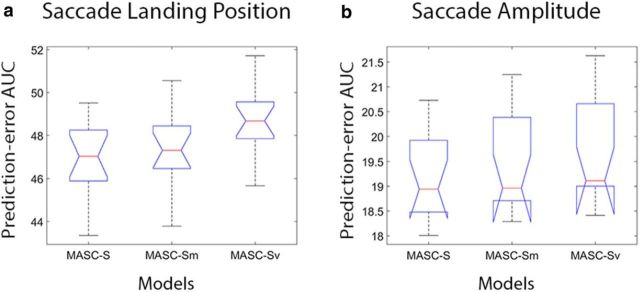
Modern computational models of attention predict fixations using saliency maps and target maps, which prioritize locations for fixation based on feature contrast and target goals, respectively. But whereas many such models are biologically plausible, none have looked to the oculomotor system for design constraints or parameter specification. Conversely, although most models of saccade programming are tightly coupled to underlying neurophysiology, none have been tested using real-world stimuli and tasks. We combined the strengths of these two approaches in MASC, a model of attention in the superior colliculus (SC) that captures known neurophysiological constraints on saccade programming. We show that MASC predicted the fixation locations of humans freely viewing naturalistic scenes and performing exemplar and categorical search tasks, a breadth achieved by no other existing model. Moreover, it did this as well or better than its more specialized state-of-the-art competitors. MASC's predictive success stems from its inclusion of high-level but core principles of SC organization: an over-representation of foveal information, size-invariant population codes, cascaded population averaging over distorted visual and motor maps, and competition between motor point images for saccade programming, all of which cause further modulation of priority (attention) after projection of saliency and target maps to the SC. Only by incorporating these organizing brain principles into our models can we fully understand the transformation of complex visual information into the saccade programs underlying movements of overt attention. With MASC, a theoretical footing now exists to generate and test computationally explicit predictions of behavioral and neural responses in visually complex real-world contexts.SIGNIFICANCE STATEMENT The superior colliculus (SC) performs a visual-to-motor transformation vital to overt attention, but existing SC models cannot predict saccades to visually complex real-world stimuli. We introduce a brain-inspired SC model that outperforms state-of-the-art image-based competitors in predicting the sequences of fixations made by humans performing a range of everyday tasks (scene viewing and exemplar and categorical search), making clear the value of looking to the brain for model design. This work is significant in that it will drive new research by making computationally explicit predictions of SC neural population activity in response to naturalistic stimuli and tasks. It will also serve as a blueprint for the construction of other brain-inspired models, helping to usher in the next generation of truly intelligent autonomous systems.

Keywords: attention; computational models; eye movements; scene viewing; superior colliculus; visual search.


Figures

Figure 1.
Figure 1.
Anatomy of MASC. a, Input is an image, blurred to reflect retinal acuity limitations. b, This image shown projected onto the SC. c, A priority map (here a saliency map) generated from the blurred image. d, The priority map projected into SC space, where it is averaged over visual point images computed throughout the visual map. The ring indicates the size of one visual point image; the visual receptive field for the neuron at the center of this point image is shown in c. e, Activity from d after a second stage of averaging over the larger motor point images. Shown is the maximally active point image, with the vector average of this population (indicated by the cross) determining the end point of MASC's initial saccade in visual space. f, Initial saccades from the four models tested and 8 (randomly selected from the 15) subjects.
Figure 2.
Figure 2.
Search experiments. a, Procedure for exemplar search. b, Representative exemplar search scanpaths from subjects and the models. c, Procedure for categorical search. d, Categorical search scanpaths. e, Target map for a specific leaf exemplar (shown enlarged in a). f, Motor map activity resulting from the target map in e projected onto the SC. The red cross indicates the center of the most active motor point image. Not shown is the preceding averaging over the visual map. g, Target map for the “leaf” category. h, Categorical target map projected onto the SC motor map.
Figure 3.
Figure 3.
The 125 objects appearing as targets in the search displays from Experiment 2. Note that in the exemplar search task these identical objects were used as picture cues to indicate the specific target before each search display, whereas in the categorical search task the target was cued by presenting one of the 25 category names. Each of the five search set size conditions used a different target from the five target exemplars per category.
Figure 4.
Figure 4.
Representative scenes and scanpaths from MASC-S (red) and six participants (cyan), randomly selected from 15, showing the first six saccades made during the Experiment 1 free-viewing task.
Figure 5.
Figure 5.
Evaluation of MASC-S in the Experiment 1 free-viewing task. a, Mean error in predicting the landing positions of the first six saccades, plotted for MASC-S (red), an Itti–Koch model (blue), the AWS model (green), a Random model (pink), and a Subject model (cyan). Error bars indicate 1 SEM. Note that the small error bars reflect stability obtained in the data after averaging over 1003 images for each subject. b, Model comparison showing for each a box and whisker plot of the area under its prediction-error curve (AUC from the curves in a) for saccade landing position. c, Similar plot of prediction errors for saccade amplitude. d, Similar model comparison for saccade amplitude.
Figure 6.
Figure 6.
Evaluation of MASC in the Experiment 2 exemplar search task. a, Plots showing mean distance traveled to the target for all subjects (cyan), MASC-T (solid red), MASC-T.S (dashed red), and WTA (blue), as a function of set size. b, Box and whisker plots comparing prediction-error AUC computed from MASC-T, MASC-T.S, WTA, and a Subject model for distance traveled to the target. Note that AUC was calculated from prediction-error curves (not shown) derived from the data in a. c, Plots showing the proportion of trials in which the target was the first fixated object for participants and the models. d, Box and whisker plots comparing MASC-T, MASC-T.S, WTA, and Subject model prediction-error AUC for the conservative target-first-fixated measure of search guidance.
Figure 7.
Figure 7.
Evaluation of MASC in the Experiment 2 categorical search task. a, Plots showing mean distance traveled to the target for all subjects (cyan), MASC-T (solid red), MASC-T.S (dashed red), and WTA (blue), as a function of set size. b, Box and whisker plots comparing MASC-T, MASC-T.S, WTA, and Subject model prediction-error AUC for distance traveled to the target. c, Plots showing the proportion of trials in which the target was the first fixated object for subjects and the models. d, Similar model comparison for the conservative target-first-fixated measure of search guidance.
Figure 8.
Figure 8.
Model evaluation of predicted initial saccade direction for exemplar and categorical search trials in which saccades were not directed initially to the target. a, Box and whisker plots comparing WTA, MASC-T, MASC-T.S, and a Subject model in their ability to predict initial saccade direction on difficult exemplar search trials. The proportion of agreement in initial saccade direction is calculated between participants and each model and averaged over trials in which the target was not the first fixated object. The dashed line indicates the chance level of agreement based on 45° angular segments and a random direction of initial saccades. b, A similar model evaluation performed for categorical search.
Figure 9.
Figure 9.
Evaluation of how the number of SC averaging operations (1 vs 2) and the profiles of the averaging windows (corresponding to motor and visual point image estimates) affect model predictions in the Experiment 1 free-viewing task. a, Box and whisker plots of prediction-error AUC for saccade landing position comparing dual-averaging (MASC-S) and single-averaging (MASC-Sm and MASC-Sv) versions of the model. b, Similar model comparison for saccade amplitude.
Figure 10.
Figure 10.
Evaluation of how the number of averaging windows and their profiles affect model predictions in the Experiment 2 search tasks. a, Box and whisker plots comparing MASC-T, MASC-Tm, and MASC-Tv prediction-error AUC for saccade distance traveled to the target during exemplar search. b–d, Similar model comparisons for target-first-fixated in exemplar search (b), distance traveled in categorical search (c), and target-first-fixated in categorical search (d).

References

    1. Alexander RG, Zelinsky GJ (2011) Visual similarity effects in categorical search. J Vis 11:1–15. 10.1167/11.8.9 - DOI - PMC - PubMed
    1. Anderson RW, Keller EL, Gandhi NJ, Das S (1998) Two-dimensional saccade-related population activity in superior colliculus in monkey. J Neurophysiol 80:798–817. - PubMed
    1. Anton-Erxleben K, Carrasco M (2013) Attentional enhancement of spatial resolution: linking behavioural and neurophysiological evidence. Nat Rev Neurosci 14:188–200. 10.1038/nrn3443 - DOI - PMC - PubMed
    1. Bay H, Tuytelaars T, Van Gool L (2006) Surf: Speeded up robust features. European Conference on Computer Vision, pp 404–417, Graz, Austria, May.
    1. Bayguinov PO, Ghitani N, Jackson MB, Basso MA (2015) A hard-wired priority map in the superior colliculus shaped by asymmetric inhibitory circuitry. J Neurophysiol 114:662–676. 10.1152/jn.00144.2015 - DOI - PMC - PubMed

Publication types