. 2016 Dec 27;8(12):3552-3567.
doi: 10.18632/aging.101150.

Sodium fluoride (NaF) induces the splenic apoptosis via endoplasmic reticulum (ER) stress pathway in vivo and in vitro

Affiliations

Sodium fluoride (NaF) induces the splenic apoptosis via endoplasmic reticulum (ER) stress pathway in vivo and in vitro

Huidan Deng et al. Aging (Albany NY). .

Abstract

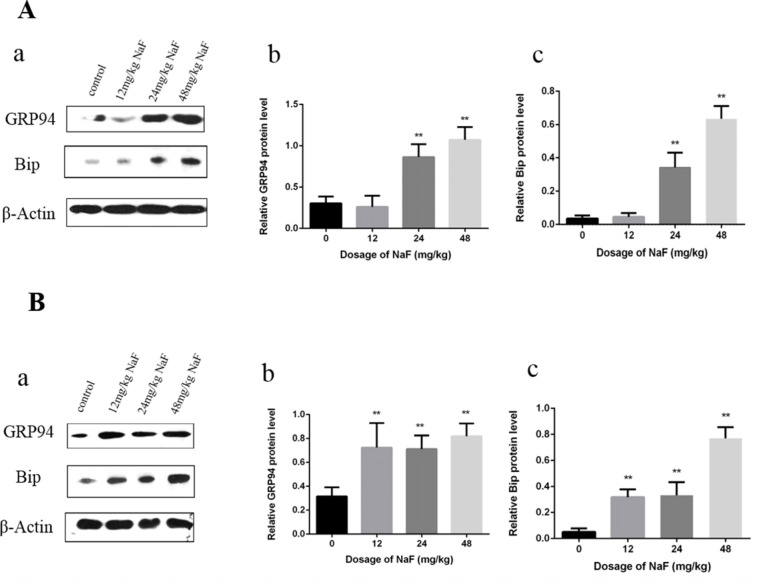
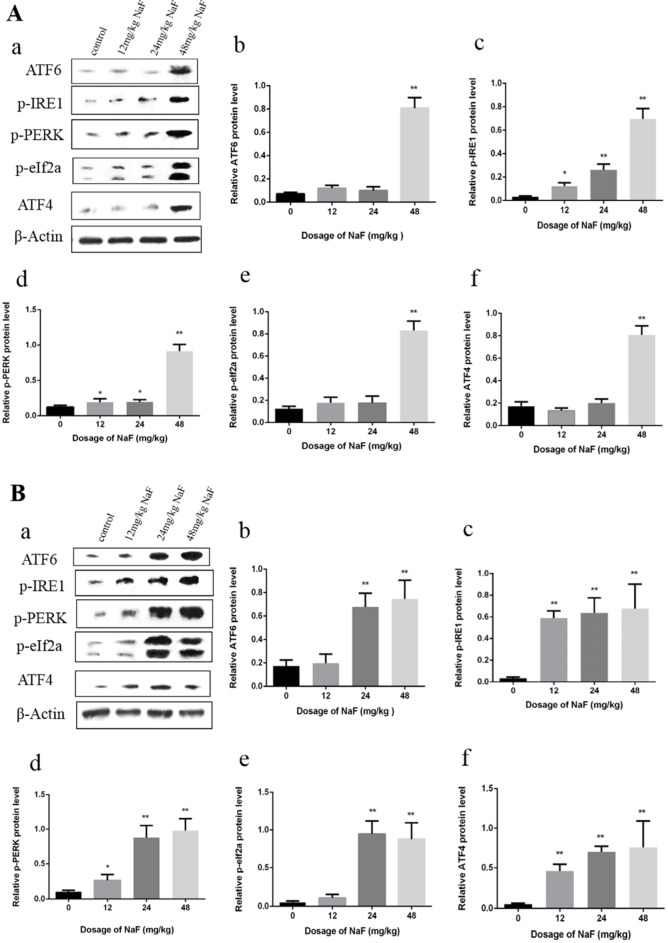
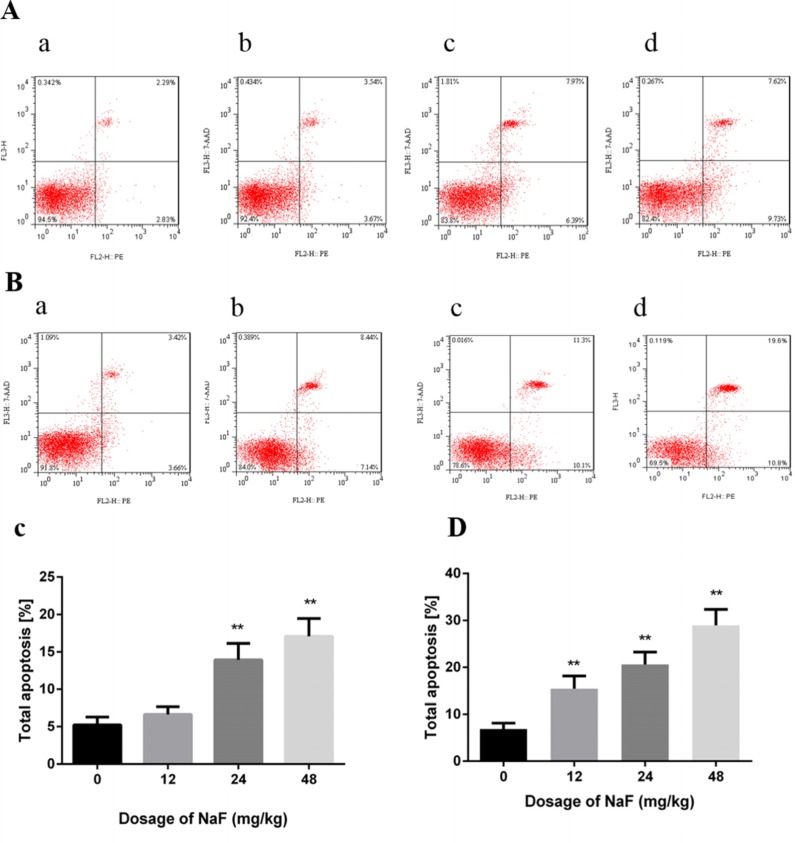
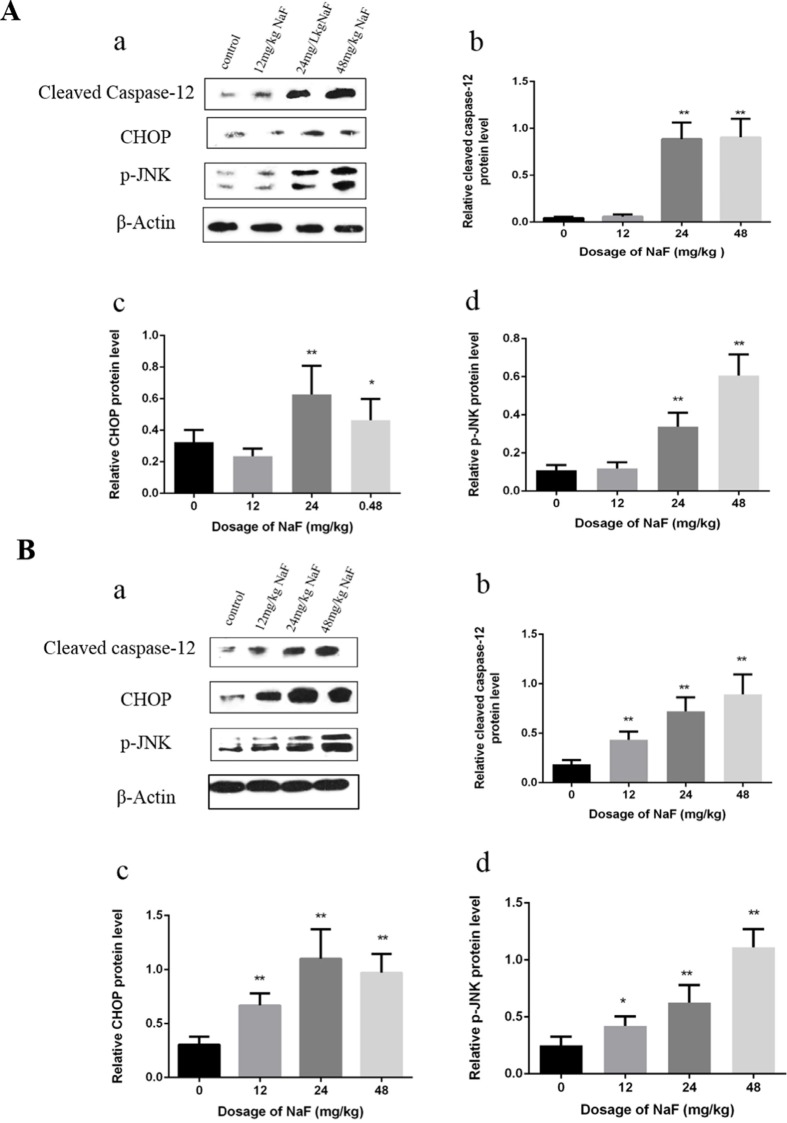
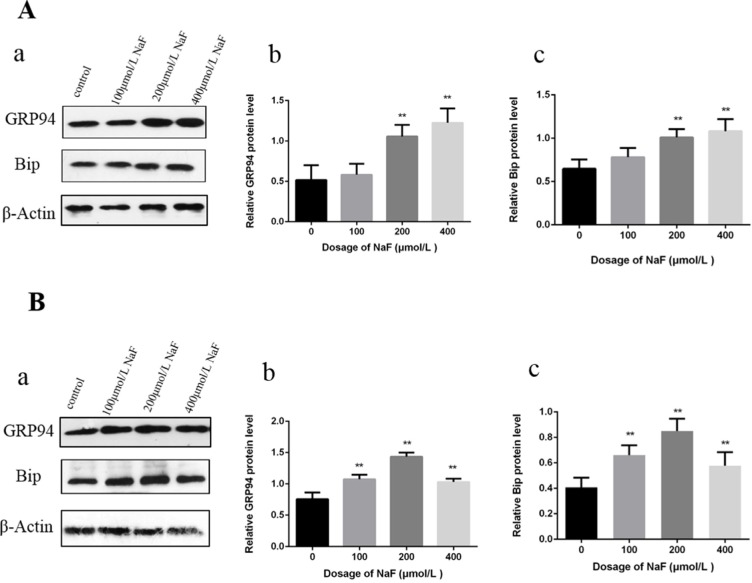
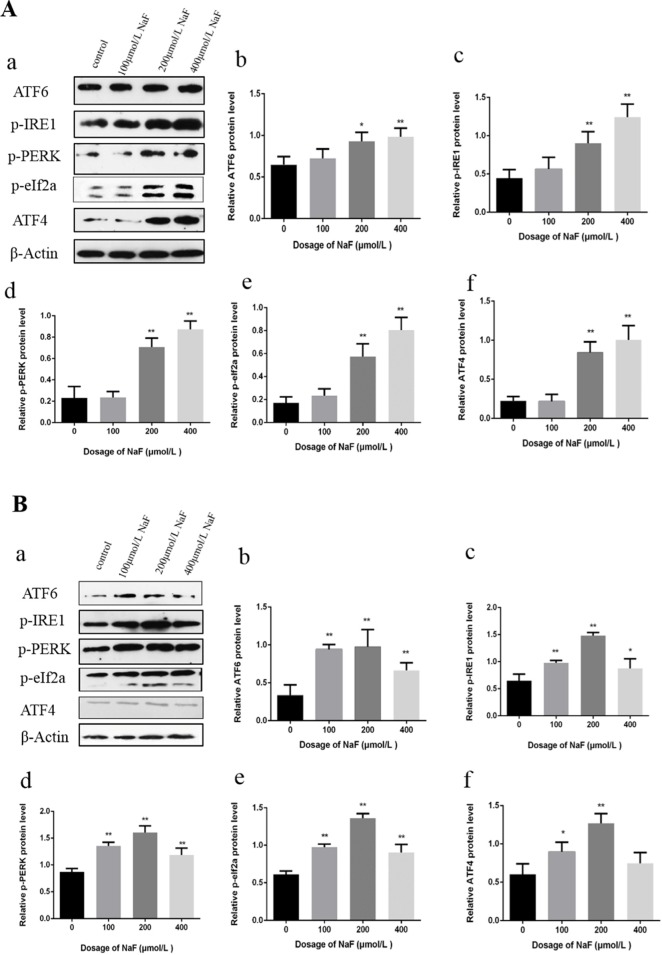
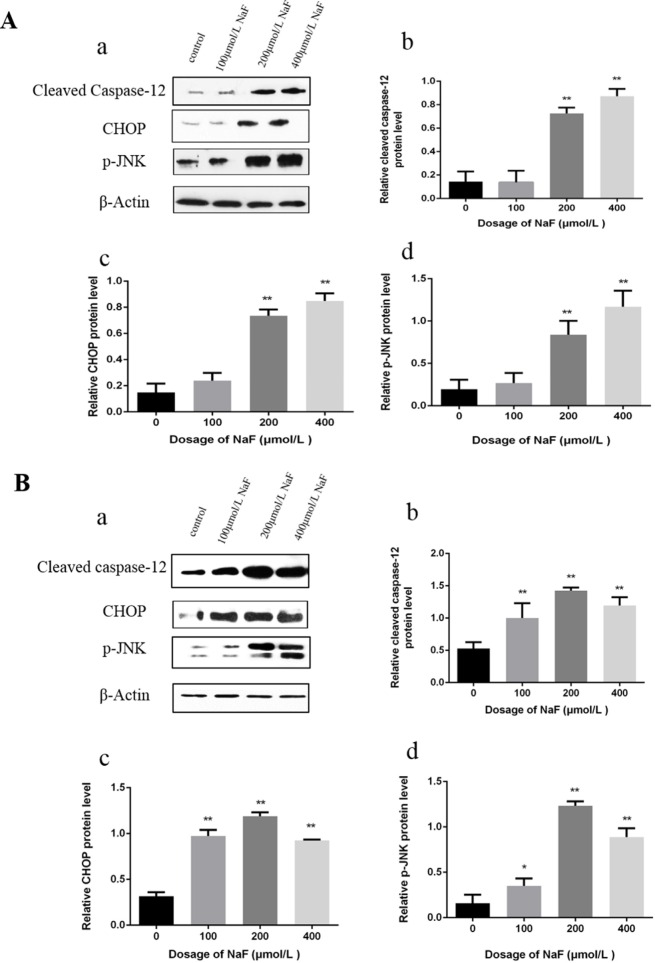
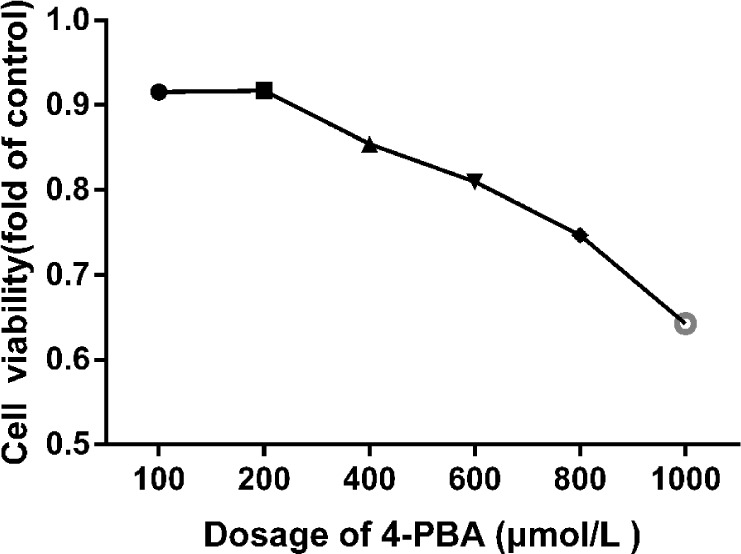
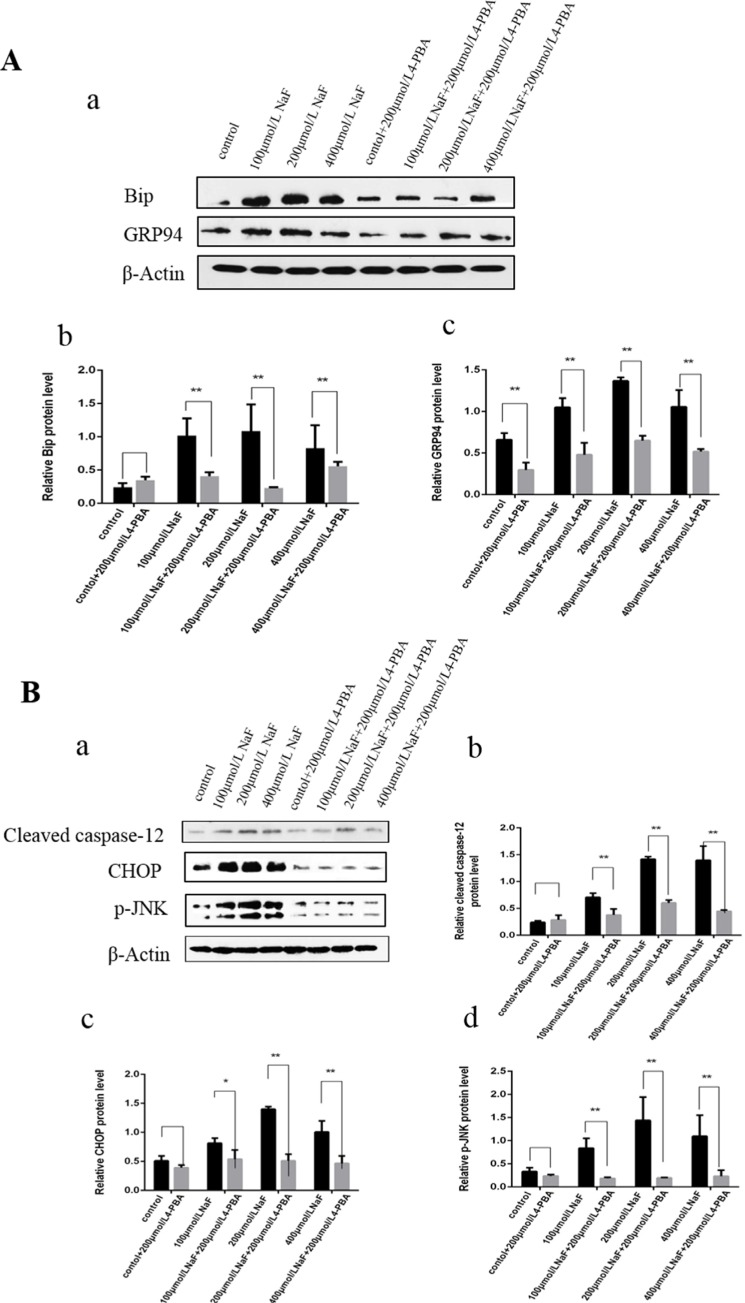
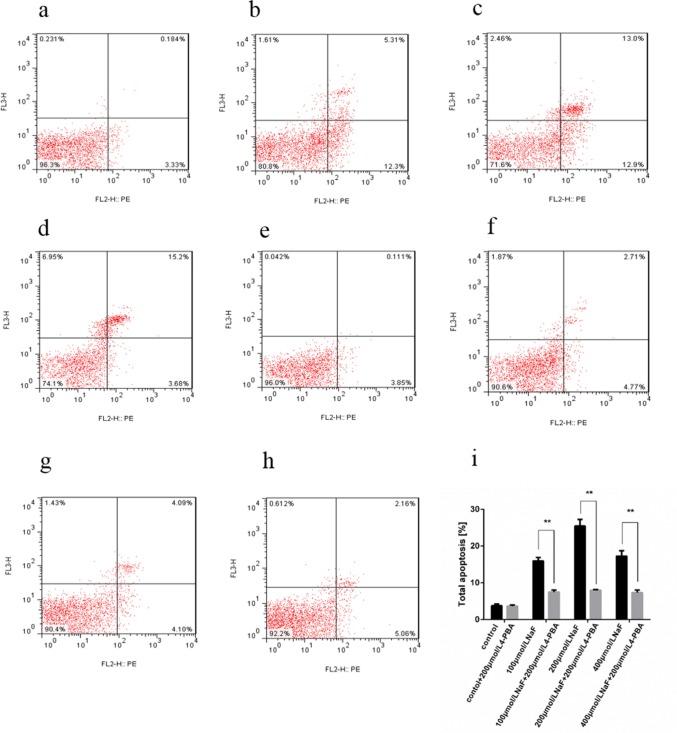
At present, there are no reports on the relationship between fluoride-induced apoptosis and endoplasmic reticulum (ER) stress (ER stress) in the spleen of human and animals in vivo and in vitro. Therefore, the aim of this study was to define sodium fluoride (NaF)-induced apoptosis mediated by ER stress in the spleen of mice in vivo and in vitro. Apoptosis and expression levels of the ER stress-related proteins were detected by flow cytometry and western blot, respectively. The results showed that NaF treatment increased lymphocytes apoptosis, which was consistent with NaF-caused ER Stress. NaF-caused ER stress was characterized by up-regulating protein expression levels of glucose-regulated protein 78 (BiP) and glucose-regulated protein 94 (GRP94), and by activating unfolded protein response (UPR). The signaling pathway of ER stress-associated apoptosis was activated by up-regulating protein expression levels of cleaved cysteine aspartate specific protease-12 (cleaved caspase-12), growth arrest and DNA damage-inducible gene 153 (Gadd153/CHOP) and phosphorylation of JUN N-terminal kinase (p-JNK). Additionally, our in vitro study found that apoptotic rate was decreased with remarkable down-regulation of the cleaved caspase-12, CHOP, p-JNK after ER stress was inhibited by 4-Phenylbutyric acid (4-PBA) treatment. In conclusion, NaF-induced apoptosis may mediated by ER stress in the spleen.

Keywords: apoptosis; endoplasmic reticulum (ER) stress; mouse; sodium fluoride (NaF); spleen.


Conflict of interest statement

The authors declare no conflicts of interest.

Figures

Figure 1
Figure 1. Effect of NaF on ER stress-related proteins in the spleen at 21 (A) and 42 (B) days of age
(a) The western blot assay. (b-c) Quantitative analysis of protein expression. Data are presented with the means ± standard deviation, * p < 0.05, ** p < 0.01, compared with the control group. Data were analyzed by the variance (ANOVA) test of the SPSS 19.0 software.
Figure 2
Figure 2. Effect of NaF on protein expression levels of ATF6, p-IRE1, p-PERK, p-eIf2a and ATF4 in the spleen at 21 (A) and 42 (B) days of age
(a) The western blot assay. (b-f) Quantitative analysis of protein expression. Data are presented with the means ± standard deviation, * p < 0.05, ** p < 0.01, compared with the control group. Data were analyzed by the variance (ANOVA) test of the SPSS 19.0 software.
Figure 3
Figure 3. Effect of NaF on apoptosis in the spleen at 21 (A, C) and 42 (B, D) days of age
(a-d) Two-dimension scatter plots depicting distribution of cells positively stained for Annexin V-PE/7-AAD. (a) CG, (b) 12 mg/kg group, (c) 24 mg/kg group and (d) 48 mg/kg group. (C-D) Quantitative analysis of total apoptotic lymphocytes. Data are presented with the means ± standard deviation, * p < 0.05, ** p < 0.01, compared with the control group. Data were analyzed by the variance (ANOVA) test of the SPSS 19.0 software.
Figure 4
Figure 4. Effect of NaF on apoptosis-related protein in mice spleen at 21(A) and 42 (B) days of age
(a) The western blot assay. (b-d) Quantitative analysis of protein expression. Data are presented with the means ± standard deviation, * p < 0.05, ** p < 0.01, compared with the control group. Data were analyzed by the variance (ANOVA) test of the SPSS 19.0 software.
Figure 5
Figure 5. Effect of NaF on protein expression levels of GRP94 and Bip in cultured splenic lymphocytes at 24 h (A) and 48 h (B)
(a) The western blot assay. (b-c) Quantitative analysis of protein expression. Data are presented with the means ± standard deviation, * p < 0.05, ** p < 0.01, compared with the control group. Data were analyzed by the variance (ANOVA) test of the SPSS 19.0 software.
Figure 6
Figure 6. Effect of NaF on protein expression levels of ATF6, p-IRE1, p-PERK, p-eIf2a and ATF4 in cultured splenic lymphocytes at 24 h (A) and 48 h (B)
(a) The western blot assay. (b-f) Quantitative analysis of protein expression. Data are presented with the means ± standard deviation, * p < 0.05, ** p < 0.01, compared with the control group. Data were analyzed by the variance (ANOVA) test of the SPSS 19.0 software.
Figure 7
Figure 7. Effect of NaF treatment on protein expression levels of cleaved caspase-12, p-JNK, CHOP in cultured splenic lymphocytes at 24 h (A) and 48 h (B)
(a) The western blot assay. (b-d) Quantitative analysis of protein expression. Data are presented with the means ± standard deviation, * p < 0.05, ** p < 0.01, compared with the control group. Data were analyzed by the variance (ANOVA) test of the SPSS 19.0 software.
Figure 8
Figure 8. Cell viabilities of 4-PBA treated splenic lymphocytes for 48 h
The cell viability was determined using a CCK8 assay as described in the methodology section. The splenic lymphocytes were incubated with different 4-PBA concentrations for 48 h. Data were analyzed by the variance (ANOVA) test of the SPSS 19.0 software.
Figure 9
Figure 9. Effect of NaF and NaF-combined with 4-PBA treatment on protein expression levels of Bip, GRP94, cleaved caspase-12, p-JNK and CHOP in cultured splenic lymphocytes at 48 h
(a) The western blot assay. (b-c) Quantitative analysis of protein expression. Data are presented with the means ± standard deviation, * p < 0.05, ** p < 0.01, compared with the control group. Data were analyzed by the variance (ANOVA) test of the SPSS 19.0 software.
Figure 10
Figure 10. Effect of NaF and NaF-combined with 200 μmol/L 4-PBA treatment on apoptosis of cultured splenic lymphocytes at 48 h
(a-h) Two-dimension scatter plots depicting distribution of cells positively stained for Annexin V-PE/7-AAD. (a) CG, (b) LG, (c) MG and (d) HG, (e) CG+4-PBA, (f) LG+4-PBA, (g) MG+4-PBA, (h) HG+4-PBA. (i) Quantitative analysis of total apoptotic lymphocytes. Data are presented with the means ± standard deviation, * p < 0.05, ** p < 0.01, compared with the control group. Data were analyzed by the variance (ANOVA) test of the SPSS 19.0 software.

References

    1. Mehri A, Marjan RF. Trace elements in human nutrition: a review. Int J Med Invest. 2013;2:115–28.
    1. DenBesten PK. Biological mechanisms of dental fluorosis relevant to the use of fluoride supplements. Community Dent Oral Epidemiol. 1999;27:41–47. doi: 10.1111/j.1600-0528.1999.tb01990.x. - DOI - PubMed
    1. Boivin G, Chavassieux P, Chapuy MC, Baud CA, Meunier PJ. Skeletal fluorosis: histomorphometric analysis of bone changes and bone fluoride content in 29 patients. Bone. 1989;10:89–99. doi: 10.1016/8756-3282(89)90004-5. - DOI - PubMed
    1. Shanthakumari D, Srinivasalu S, Subramanian S. Effect of fluoride intoxication on lipidperoxidation and antioxidant status in experimental rats. Toxicology. 2004;204:219–28. doi: 10.1016/j.tox.2004.06.058. - DOI - PubMed
    1. Nabavi SF, Moghaddam AH, Eslami S, Nabavi SM. Protective effects of curcumin against sodium fluoride-induced toxicity in rat kidneys. Biol Trace Elem Res. 2012;145:369–74. doi: 10.1007/s12011-011-9194-7. - DOI - PubMed

Publication types