Clinical Trial
. 2016 Dec 31;109(5):djw272.
doi: 10.1093/jnci/djw272. Print 2017 May.

Prognostic Value of BRAF and KRAS Mutations in MSI and MSS Stage III Colon Cancer

Affiliations
Clinical Trial

Prognostic Value of BRAF and KRAS Mutations in MSI and MSS Stage III Colon Cancer

Julien Taieb et al. J Natl Cancer Inst. .

Abstract

Background: The prognostic value of BRAF and KRAS mutations within microsatellite-unstable (MSI) and microsatellite-stable (MSS) subgroups of resected colon carcinoma patients remains controversial. We examined this question in prospectively collected biospecimens from stage III colon cancer with separate analysis of MSI and MSS tumors from patients receiving adjuvant FOLFOX +/- cetuximab in two adjuvant therapy trials.

Methods: Three groups were defined: BRAF Mutant, KRAS Mutant, and double wild-type. The analytic strategy involved estimation of study-specific effects, assessment of homogeneity of results, and then analysis of pooled data as no differences in patient outcome were found between treatment arms in both trials. Associations of mutations with patient outcome were analyzed, and multivariable models were adjusted for treatment and relevant factors.

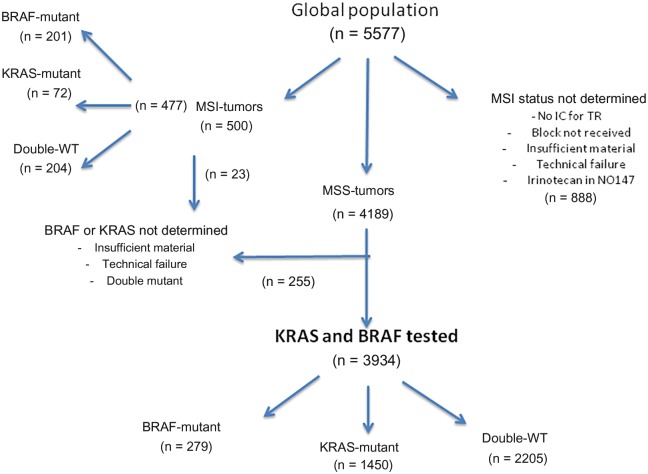
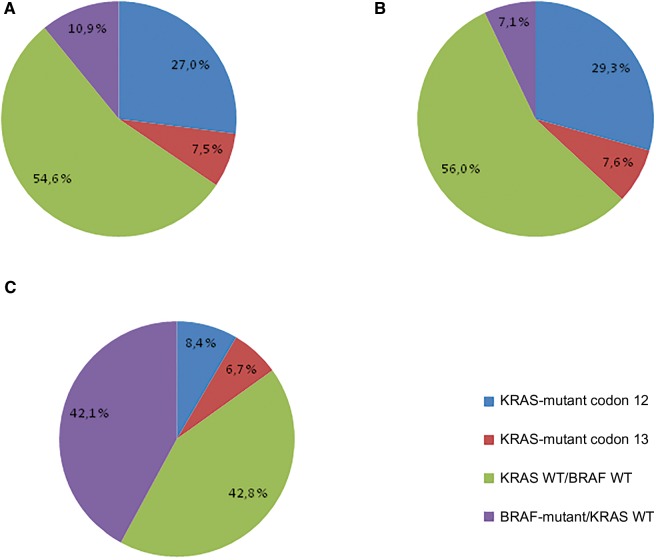
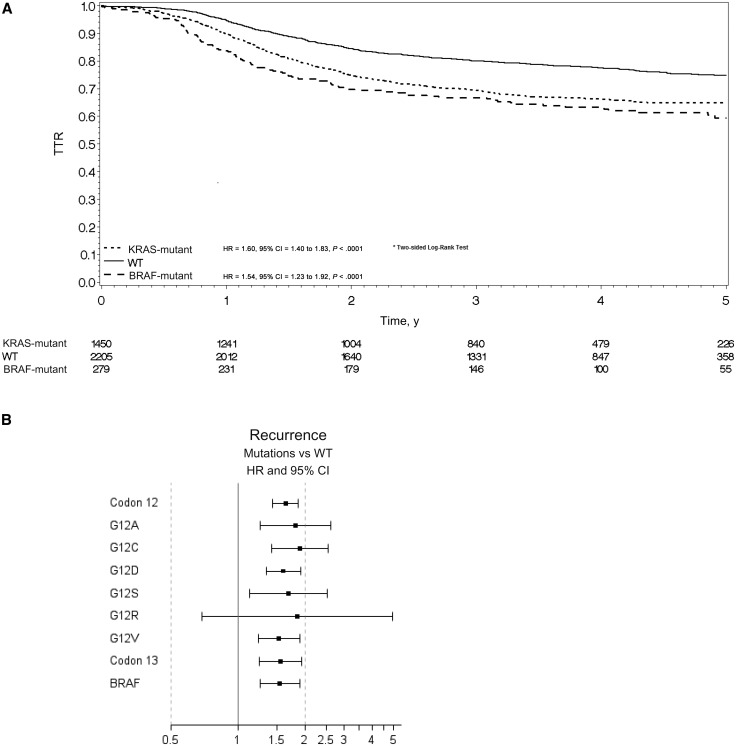
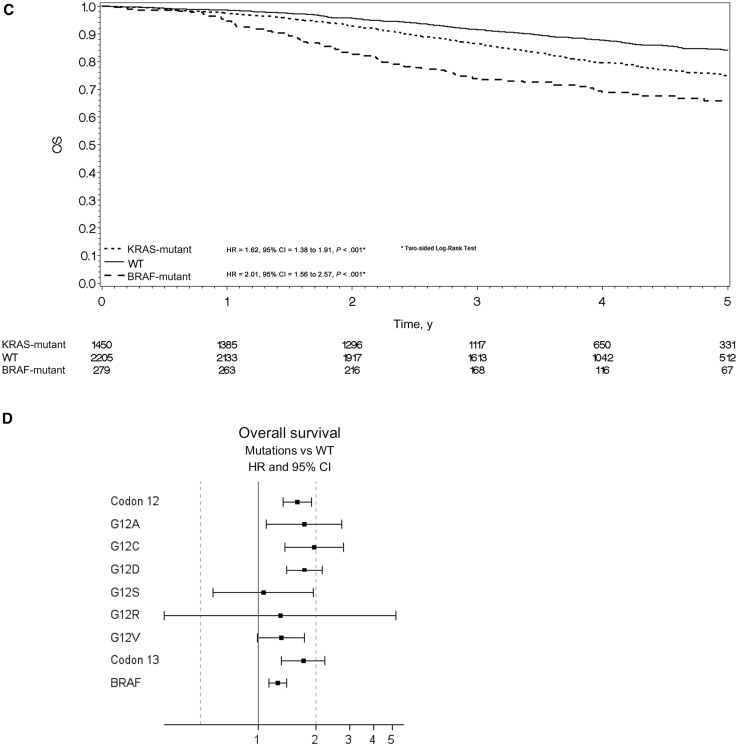
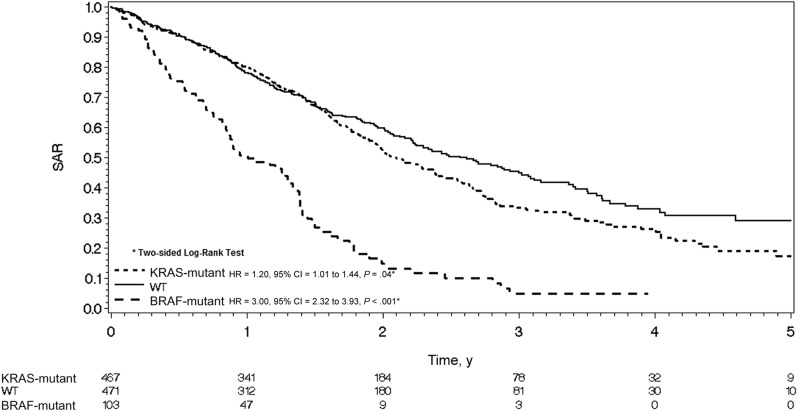
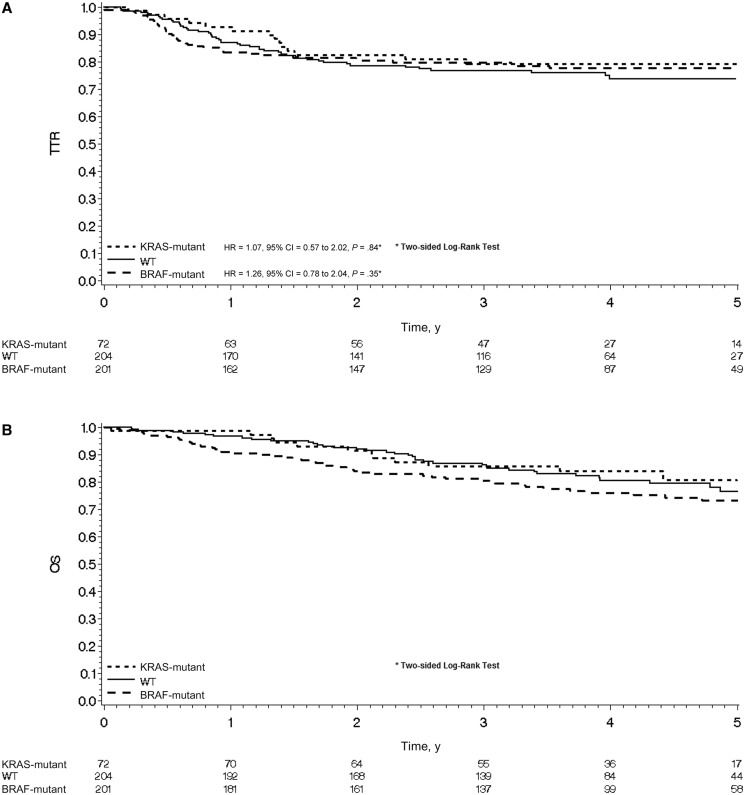
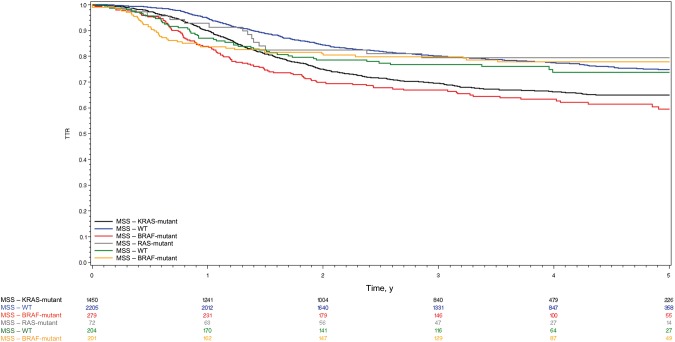
Results: Four thousand four hundred eleven tumors were evaluable for BRAF and KRAS mutations and mismatch repair status; 3934 were MSS and 477 were MSI. In MSS patients, all BRAF V600E mutations (hazard ratio [HR] = 1.54, 95% confidence interval [CI] = 1.23 to 1.92, P < .001), KRAS codon 12 alterations, and p.G13D mutations (HR = 1.60, 95% CI = 1.40 to 1.83, P < .001) were associated with shorter time to recurrence (TTR) and shorter survival after relapse (SAR; HR = 3.02 , 95% CI = 2.32 to 3.93, P < .001, and HR = 1.20, 95% CI = 1.01 to 1.44, P = .04, respectively). Overall survival (OS) in MSS patients was poorer for BRAF-mutant patients (HR = 2.01, 95% CI = 1.56 to 2.57, P < .001) and KRAS-mutant patients (HR = 1.62, 95% CI = 1.38 to 1.91, P < .001) vs wild-type. No prognostic role of KRAS or BRAF mutations was seen in MSI patients. Furthermore, no interaction was found between treatment arm (with or without cetuximab) and KRAS and BRAF mutations for TTR or OS in MSS patients.

Conclusions: In a pooled analysis of resected stage III colon cancer patients receiving adjuvant FOLFOX, BRAF or KRAS mutations are independently associated with shorter TTR, SAR, and OS in patients with MSS, but not MSI, tumors. Future clinical trials in the adjuvant setting should consider these mutations as important stratification factors.


Figures

Figure 1.
Figure 1.
Flow chart of molecular analysis of PETACC8-N0147 trials molecular study evaluating the association of BRAF and KRAS mutations with time to recurrence and overall survival in microsatellite-stable and microsatellite-unstable populations. IC = informed consent; MSI = microsatellite-unstable; MSS = microsatellite-stable; TR = translational research; WT = wild-type.
Figure 2.
Figure 2.
KRAS and BRAF mutation frequency in overall (A), microsatellite-stable (B), and microsatellite-unstable (C) tumors. MSI = microsatellite-unstable; MSS = microsatellite-stable; WT = wild-type.
Figure 3.
Figure 3.
Time to recurrence (TTR) and overall survival (OS) for microsatellite-stable (MSS) population. A) Kaplan-Meier curve for time to recurrence (TTR) in the MSS population by mutational status. Hazard ratios and 95% confidence intervals were calculated using the adjusted Cox proportional hazard model. B) Univariate analysis was performed using the Cox proportional hazard model for TTR in the MSS population by specific mutations. Solid circles represent hazard ratio, and open-ended horizontal lines represent the 95% confidence intervals. C) Kaplan-Meier curve for overall survival (OS) in the MSS population by mutational status. Hazard ratios and 95% confidence intervals were calculated using the adjusted Cox proportional hazard model. D) Univariate analysis was performed using the Cox proportional hazard model for death in the MSS population by specific mutations. Solid circles represent hazard ratio, and open-ended horizontal lines represent the 95% confidence intervals. CI = confidence interval; HR = hazard ratio; OS = overall survival; TTR = time to recurrence; WT = wild-type.
Figure 3.
Figure 3.
Time to recurrence (TTR) and overall survival (OS) for microsatellite-stable (MSS) population. A) Kaplan-Meier curve for time to recurrence (TTR) in the MSS population by mutational status. Hazard ratios and 95% confidence intervals were calculated using the adjusted Cox proportional hazard model. B) Univariate analysis was performed using the Cox proportional hazard model for TTR in the MSS population by specific mutations. Solid circles represent hazard ratio, and open-ended horizontal lines represent the 95% confidence intervals. C) Kaplan-Meier curve for overall survival (OS) in the MSS population by mutational status. Hazard ratios and 95% confidence intervals were calculated using the adjusted Cox proportional hazard model. D) Univariate analysis was performed using the Cox proportional hazard model for death in the MSS population by specific mutations. Solid circles represent hazard ratio, and open-ended horizontal lines represent the 95% confidence intervals. CI = confidence interval; HR = hazard ratio; OS = overall survival; TTR = time to recurrence; WT = wild-type.
Figure 4.
Figure 4.
Kaplan-Meier curve for survival after relapse in the microsatellite-stable population by mutational status. Hazard ratios and 95% confidence intervals were calculated using the Cox proportional hazard model. CI = confidence interval; HR = hazard ratio; SAR = survival after relapse; WT = wild-type.
Figure 5.
Figure 5.
A) Kaplan-Meier curve for time to recurrence in the microsatellite-unstable (MSI) population by mutational status. Hazard ratio and 95% confidence intervals were calculated using the adjusted Cox proportional hazard model or (B) Kaplan-Meier curve for overall survival in the MSI population by mutational status. Hazard ratios and 95% confidence intervals were calculated using the adjusted Cox proportional hazard model. CI = confidence interval; HR = hazard ratio; OS = overall survival; TTR = time to recurrence; WT = wild-type.
Figure 6.
Figure 6.
Kaplan-Meier curve for time to recurrence in the microsatellite-stable and the microsatellite-unstable population according to mutational status. MSI = microsatellite-unstable; MSS = microsatellite-stable; TTR = time to recurrence; WT = wild-type.

References

    1. Boyle P, Langman JS.. ABC of colorectal cancer: Epidemiology. BMJ. 2000;321(7264):805–808. - PMC - PubMed
    1. Jemal A, Siegel R, Ward E, et al.Cancer statistics, 2008. CA Cancer J Clin. 2008;58(2):71–96. - PubMed
    1. Benson AB 3rd, Venook AP, Bekaii-Saab T, et al.Colon cancer, version 3.2014. J Natl Compr Canc Netw. 2014;12(7):1028–1059. - PubMed
    1. Van Cutsem E, Cervantes A, Nordlinger B, et al.Metastatic colorectal cancer: ESMO Clinical Practice Guidelines for diagnosis, treatment and follow-up. Ann Oncol. 2014;25(suppl 3):iii1–iii9. - PubMed
    1. Bokemeyer C, Bondarenko I, Hartmann JT, et al.Efficacy according to biomarker status of cetuximab plus FOLFOX-4 as first-line treatment for metastatic colorectal cancer: The OPUS study. Ann Oncol. 2011;22(7):1535–1546. - PubMed

Publication types

MeSH terms

Supplementary concepts