. 2017 Mar 1;26(5):1018-1030.
doi: 10.1093/hmg/ddw433.

Quantifying the extent to which index event biases influence large genetic association studies

Affiliations

Quantifying the extent to which index event biases influence large genetic association studies

Hanieh Yaghootkar et al. Hum Mol Genet. .

Abstract

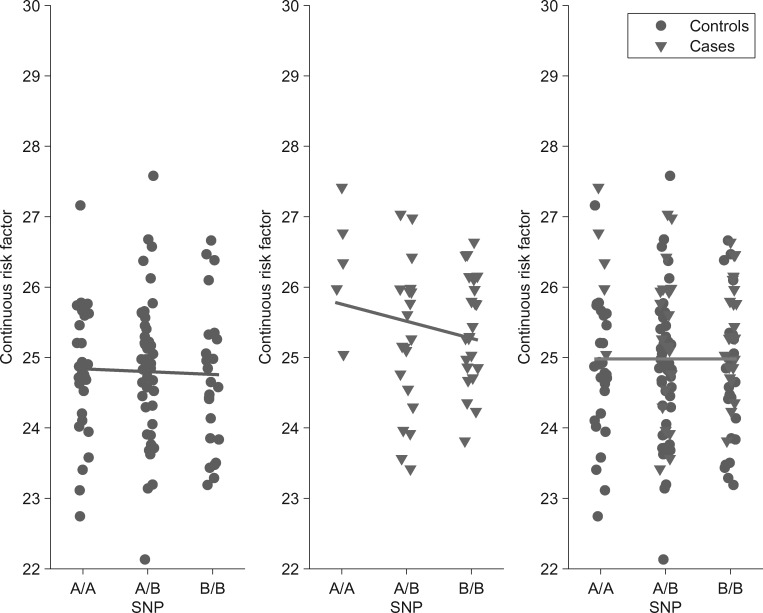
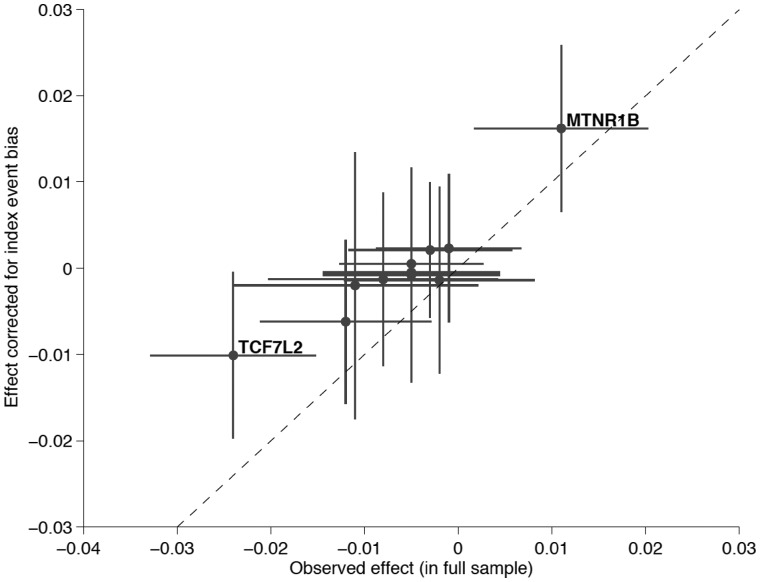
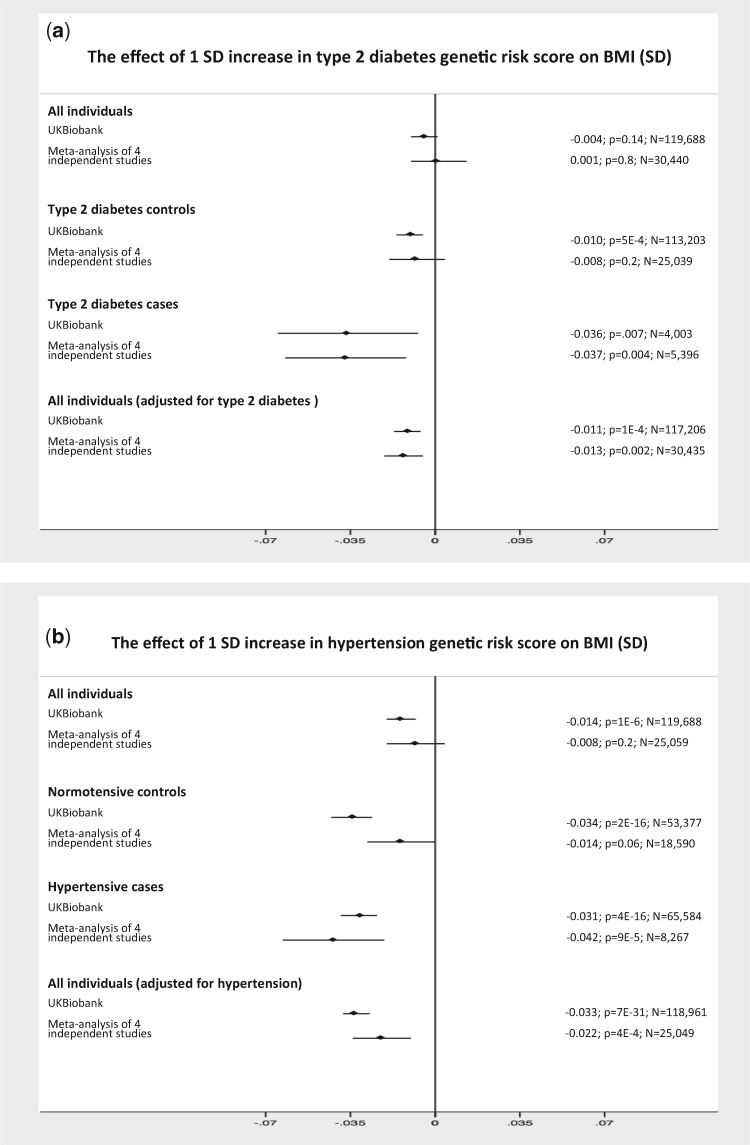
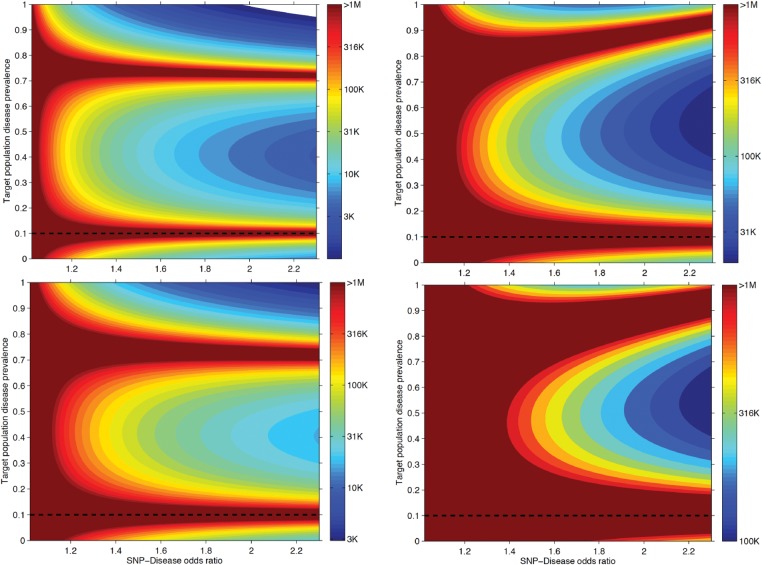
As genetic association studies increase in size to 100 000s of individuals, subtle biases may influence conclusions. One possible bias is 'index event bias' (IEB) that appears due to the stratification by, or enrichment for, disease status when testing associations between genetic variants and a disease-associated trait. We aimed to test the extent to which IEB influences some known trait associations in a range of study designs and provide a statistical framework for assessing future associations. Analyzing data from 113 203 non-diabetic UK Biobank participants, we observed three (near TCF7L2, CDKN2AB and CDKAL1) overestimated (body mass index (BMI) decreasing) and one (near MTNR1B) underestimated (BMI increasing) associations among 11 type 2 diabetes risk alleles (at P < 0.05). IEB became even stronger when we tested a type 2 diabetes genetic risk score composed of these 11 variants (-0.010 standard deviations BMI per allele, P = 5 × 10- 4), which was confirmed in four additional independent studies. Similar results emerged when examining the effect of blood pressure increasing alleles on BMI in normotensive UK Biobank samples. Furthermore, we demonstrated that, under realistic scenarios, common disease alleles would become associated at P < 5 × 10- 8 with disease-related traits through IEB alone, if disease prevalence in the sample differs appreciably from the background population prevalence. For example, some hypertension and type 2 diabetes alleles will be associated with BMI in sample sizes of >500 000 if the prevalence of those diseases differs by >10% from the background population. In conclusion, IEB may result in false positive or negative genetic associations in very large studies stratified or strongly enriched for/against disease cases.


Figures

Figure 1
Figure 1
Apparently paradoxical gene-phenotype associations in the context of disease stratified genetic studies. We simulated genotype, continuous risk factor values and disease status in a general population sample according to our liability scale model and set the genetic effect on the risk factor (γ) to zero. We observed that the estimated effect of the ‘B’ allele of a genetic marker on a continuous trait is negative both in cases and controls. Disease carriers also have higher trait value than controls. However, when combining the two strata the marker is—as expected— not associated with the trait. The reason for this apparent paradox is that the proportion of disease risk allele ‘B’) carriers is higher in the case group. Thus when merging cases into the control group the mean trait value of the BB group increases much more than it does in the other genotype groups. This concept is recognized as Simpson's paradox (40).
Figure 2
Figure 2
Enrichment for cases or controls produces spurious associations. We applied our analytical formula to compute the effect size estimate of a SNP (G) on a continuous risk factor (X) in the abovementioned liability scale model setting with the true genetic effect on the risk factor (γ) being zero. Enrichment for cases or controls produces spurious evidence of association between disease risk alleles and a risk factor correlated with the disease (equivalent to 2.5 OR per SD) in (A) a scenario where a risk allele (MAF 30%) increases risk with an effect equivalent to an OR of 1.4 (similar to the TCF7L2 type 2 diabetes scenario 10) in two models: unadjusted for disease status (solid curve) and adjusted for disease status (dashed curve). (Dash-)dotted lines represent 95% confidence interval (CI) around the effect estimate assuming a population of 100 000 individuals. (B) displays the same curves, but for a SNP with a rare protective allele (MAF 2%) that reduces risk of disease with an effect equivalent to an OR of 0.5 (similar to the CCND2 type 2 diabetes scenario 9). Vertical dashed line at 0.05 indicates the true general population disease prevalence.
Figure 3
Figure 3
Scatter plot of the observed effect of type 2 diabetes-associated SNPs on BMI in the total UK Biobank sample vs. the IEB corrected effect. The effect corrected for IEB (shown on the y-axis) was calculated assuming the previously established 10% population prevalence of type 2 diabetes (π0=0.10). Dashed line represents the identity line, where the two effects are equal. While for most SNPs the absolute value effect size estimate after IEB correction is reduced, MTNR1B shows increased effect size upon correction. Only this latter SNP produced a P-value surviving multiple testing correction (P  <  0.05/11).
Figure 4
Figure 4
IEB in real data. (A) The GRS associated with higher risk of type 2 diabetes is associated with lower BMI in cases and controls separately and when combined but adjusted for type 2 diabetes status. (B) The GRS associated with higher risk of hypertension is associated with lower BMI in hypertensive cases and controls separately and when combined but adjusted for hypertension status. The x-axis is the effect size per disease risk allele. The vertical solid line is the null effect.
Figure 5
Figure 5
Power calculation to detect IEB. Using the analytical formula for IEB, we derived the minimal necessary sample size to observe IEB in a study at nominal (α  =  0.05, top panels) and genome-wide significant level (α  =  5E-8, bottom panels) with 80% power. We fixed the disease prevalence in the general population to 10%. The SNP-disease OR was varied between 1 and 2.3 and the observed population prevalence of the disease was explored for the full range of 0 − 100%. The SNP MAF was set to 30% in the left panels and to 2% in right panel.

References

    1. Locke A.E., Kahali B., Berndt S.I., Justice A.E., Pers T.H., Day F.R., Powell C., Vedantam S., Buchkovich M.L., Yang J.. et al. (2015) Genetic studies of body mass index yield new insights for obesity biology. Nature, 518, 197–206. - PMC - PubMed
    1. Shungin D., Winkler T.W., Croteau-Chonka D.C., Ferreira T., Locke A.E., Magi R., Strawbridge R.J., Pers T.H., Fischer K., Justice A.E.. et al. (2015) New genetic loci link adipose and insulin biology to body fat distribution. Nature, 518, 187–196. - PMC - PubMed
    1. Wood A.R., Esko T., Yang J., Vedantam S., Pers T.H., Gustafsson S., Chu A.Y., Estrada K., Luan J., Kutalik Z.. et al. (2014) Defining the role of common variation in the genomic and biological architecture of adult human height. Nat Genet, 46, 1173–1186. - PMC - PubMed
    1. Novembre J., Johnson T., Bryc K., Kutalik Z., Boyko A.R., Auton A., Indap A., King K.S., Bergmann S., Nelson M.R.. et al. (2008) Genes mirror geography within Europe. Nature, 456, 98–101. - PMC - PubMed
    1. Kang H.M., Sul J.H., Service S.K., Zaitlen N.A., Kong S.Y., Freimer N.B., Sabatti C., Eskin E. (2010) Variance component model to account for sample structure in genome-wide association studies. Nat Genet, 42, 348–354. - PMC - PubMed

Publication types