. 2017 Feb 9;7(2):671-691.
doi: 10.1534/g3.116.037168.

An Unbiased Estimator of Gene Diversity with Improved Variance for Samples Containing Related and Inbred Individuals of any Ploidy

Affiliations

An Unbiased Estimator of Gene Diversity with Improved Variance for Samples Containing Related and Inbred Individuals of any Ploidy

Alexandre M Harris et al. G3 (Bethesda). .

Abstract

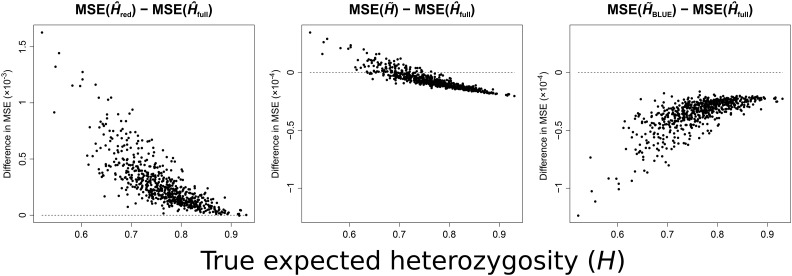
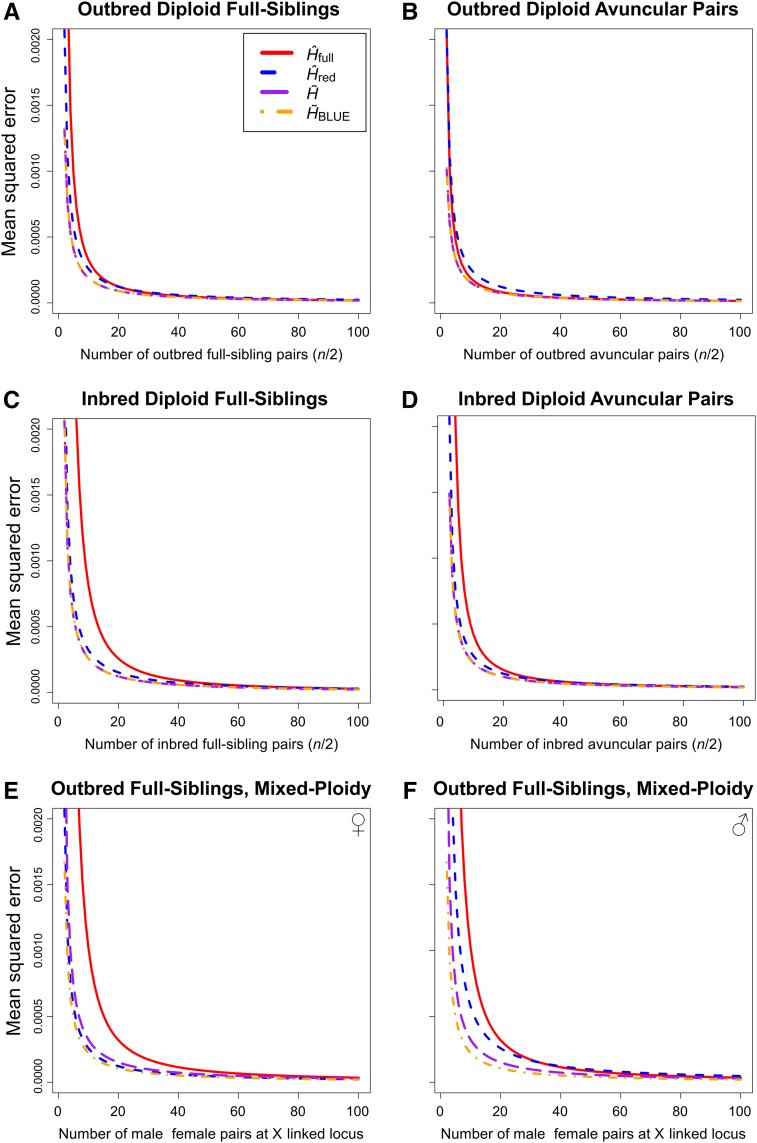
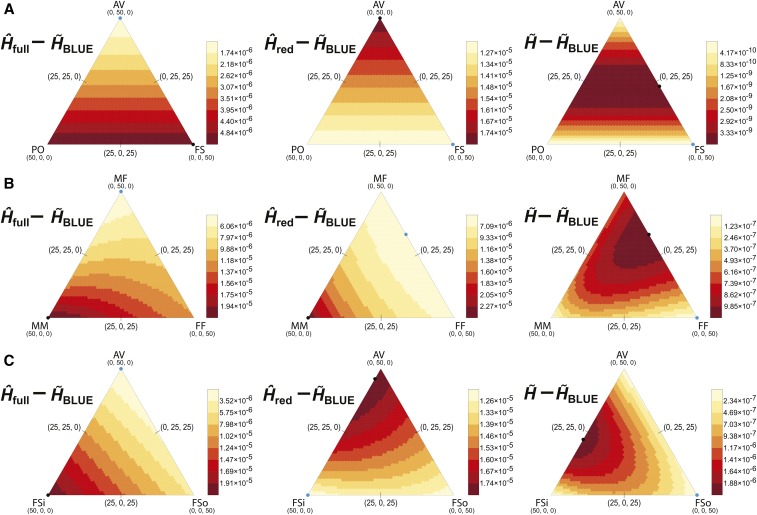
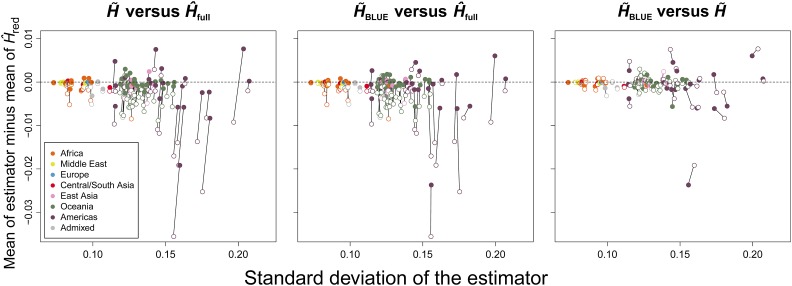
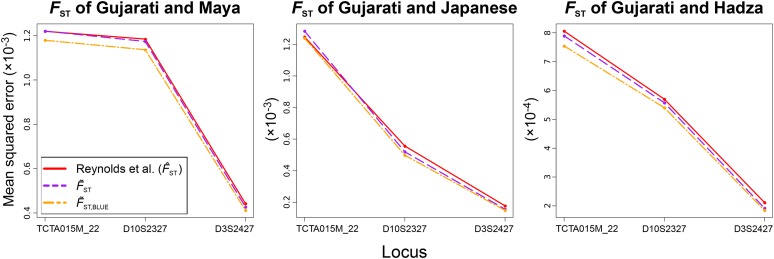
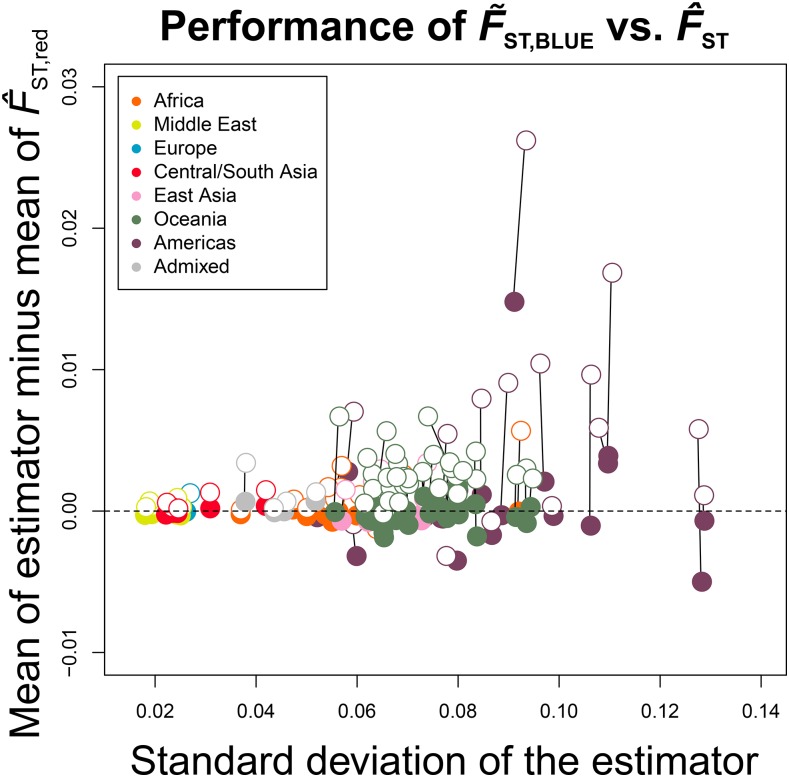
Gene diversity, or expected heterozygosity (H), is a common statistic for assessing genetic variation within populations. Estimation of this statistic decreases in accuracy and precision when individuals are related or inbred, due to increased dependence among allele copies in the sample. The original unbiased estimator of expected heterozygosity underestimates true population diversity in samples containing relatives, as it only accounts for sample size. More recently, a general unbiased estimator of expected heterozygosity was developed that explicitly accounts for related and inbred individuals in samples. Though unbiased, this estimator's variance is greater than that of the original estimator. To address this issue, we introduce a general unbiased estimator of gene diversity for samples containing related or inbred individuals, which employs the best linear unbiased estimator of allele frequencies, rather than the commonly used sample proportion. We examine the properties of this estimator, [Formula: see text] relative to alternative estimators using simulations and theoretical predictions, and show that it predominantly has the smallest mean squared error relative to others. Further, we empirically assess the performance of [Formula: see text] on a global human microsatellite dataset of 5795 individuals, from 267 populations, genotyped at 645 loci. Additionally, we show that the improved variance of [Formula: see text] leads to improved estimates of the population differentiation statistic, [Formula: see text] which employs measures of gene diversity within its calculation. Finally, we provide an R script, BestHet, to compute this estimator from genomic and pedigree data.

Keywords: expected heterozygosity; identity state; inbreeding; locus-specific branch length; relatedness.


Figures

Figure 1
Figure 1
Theoretical difference in MSE between the unbiased estimator H^red (left), H (center), or HBLUE (right), and the biased estimator H^full calculated at each of 645 microsatellite loci (0.5212H0.9301) in the MS5795 dataset for samples of 60 diploid individuals containing some inbred relative pairs. Each sampled individual was related to exactly one other, and samples contained 10 pairs of inbred full-siblings (Φ=3/8), 10 pairs of outbred full-siblings (Φ=1/4), and 10 outbred avuncular pairs (Φ=1/8). Dotted lines in each plot correspond to a difference in MSE of zero with H^full. See File S1 for the true expected heterozygosity values incorporated into analytical calculations.
Figure 2
Figure 2
Theoretical MSE as a function of sample size for samples of outbred diploid full-siblings (A), outbred diploid avuncular pairs (B), inbred diploid full-siblings (C), inbred diploid avuncular pairs (D), male-female full siblings at an X-linked locus with the reduced set omitting males and retaining females (E), and male-female full siblings at an X-linked locus with the reduced set omitting females and retaining males (F). The samples were evaluated for the D3S2427 locus (H=0.9301), and sample size was always twice the number of relative pairs included in the sample for samples containing 2–100 relative pairs. Each individual in the sample was related to exactly one other.
Figure 3
Figure 3
Theoretical difference in MSE between H^full (left), H^red (center), or H (right), and HBLUE, for samples of 100 (A) outbred diploid individuals, (B) male and female individuals at an X-linked locus, or (C) diploid individuals wherein some full siblings are inbred with brother-sister parents. The samples and MSE values considered for each subtraction were modeled on the D3S2427 locus (H=0.9301). Each sample contained 50 relative pairs, such that each individual was related to exactly one other. Each sample configuration is a single point in the space of a heat map defined by three coordinates (each representing the count of a relative pair type). For each configuration, the MSE of HBLUE is subtracted from that of the other estimators, yielding a value >0. Samples were composed of one to three relative pair types where the vertex of each heat map represents a sample with only a single relative pair type. The relative pair types were (A) parent-offspring (PO), second-degree avuncular (AV), and full-sibling (FS), (B) male-male (MM), male-female (MF), and female-female (FF) full-sibling such that the number of males and females in each sample is not fixed, or (C) inbred full-sibling (FSi), second-degree avuncular (AV), and outbred full-sibling (FSo). Blue and black points indicate the smallest and largest values, respectively, on each map. Threshold values for coloration are indicated in the scales to the right of each heat map, with smaller values colored lighter. Note that the scales are not identical across heat maps. The values upon which these subtractions are based are represented as heat maps in (A) Figure S4A, (B) Figure S4B, or (C) Figure S4C.
Figure 4
Figure 4
Application of the estimators to dataset MS5795. Here, we show a comparison of two estimators at a time (H^full, H, or HBLUE) by the difference in their mean with that of H^red across the 645 sampled microsatellite loci of MS5795 (vertical axis), and by their SDs (horizontal axis). The horizontal dotted line corresponds to no difference between the mean of the estimator and the mean of the unbiased estimator H^red. Solid lines connect calculations made for the same population with different estimators. Points are colored by geographic division defined in the dataset. Only the 93 populations with relatives in their samples were included because H^full, H, and HBLUE return the same value for samples of unrelated individuals. In the leftmost plot, open points are estimates for H^full, while closed points are for H. In the center plot, open points are estimates for H^full, while closed points are for HBLUE. In the rightmost plot, open points are estimates for H, while closed points are for HBLUE.
Figure 5
Figure 5
Application of the estimators H^full, H, and HBLUE to the calculation of FST as F^ST, FST, and FST,BLUE, respectively, using simulated data for the Gujarati sample, with either the Maya (left), Japanese (center), or Hadza (right) samples, showing MSE on the vertical axis. The Reynolds et al. (1983) estimator is equivalent to the application of H^full in calculating population differentiation. The simulated samples contained 60 individuals and 30 relative pairs, of which 10 were inbred full-siblings, 10 were outbred full-siblings, and 10 were outbred avuncular pairs. Each individual was related to exactly one other, and the data were simulated following the same probabilistic method as employed to generate Figure S2. The three loci displayed on the horizontal axis are the least diverse, median diverse, and most diverse loci of the 645 MS5795 human microsatellites.
Figure 6
Figure 6
Application of the estimators HBLUE and H^full to the estimation of FST as F^ST and FST,BLUE, respectively, from empirical data. Similarly to Figure 4, the difference between the mean of the estimator of FST (either derived from HBLUE or H^full) and an unbiased estimator (derived from H^red), is displayed on the vertical axis, while the SD of the estimator is displayed on the horizontal axis. The empty circles represent the Reynolds et al. (1983) estimator (identical to the H^full-derived estimation), while the filled circles represent the estimation derived from HBLUE. Here, the FST values for the French sample with each of the 92 other samples containing related individuals in the dataset MS5795 are plotted, colored by the region of the changing sample.

Similar articles

Cited by

References

    1. Abney M., Ober C., McPeek M. S., 2002. Quantitative-trait homozygosity and association mapping and empirical genomewide significance in large, complex pedigrees: fasting serum-insulin level in the Hutterites. Am. J. Hum. Genet. 70: 920–934. - PMC - PubMed
    1. Blekhman R., Goodrich J. K., Huang K., Sun Q., Bukowski R., et al. , 2015. Host genetic variation impacts microbiome composition across human body sites. Genome Biol. 16: 191. - PMC - PubMed
    1. Butler I. A., Siletti K., Oxley P. R., Kronauer D. J. C., 2014. Conserved microsatellites in ants enable population genetic and colony pedigree studies across a wide range of species. PLoS One 9: e107334. - PMC - PubMed
    1. Capocasa M., Battagia C., Anagnostou P., Montinaro F., Boschi I., et al. , 2013. Detecting genetic isolation in human populations: a study of European language minorities. PLoS One 8: e56371. - PMC - PubMed
    1. Chong J. X., Oktay A. A., Dai Z., Swoboda K. J., Prior T. W., et al. , 2011. A common spinal muscular atrophy deletion mutation is present on a single founder haplotype in the US Hutterites. Eur. J. Hum. Genet. 19: 1045–1051. - PMC - PubMed

Publication types

LinkOut - more resources